
In our previous blog we have learnt embedding of Power BI tiles in PowerApps. Now, in this blog we’ll learn Charts in PowerApps.
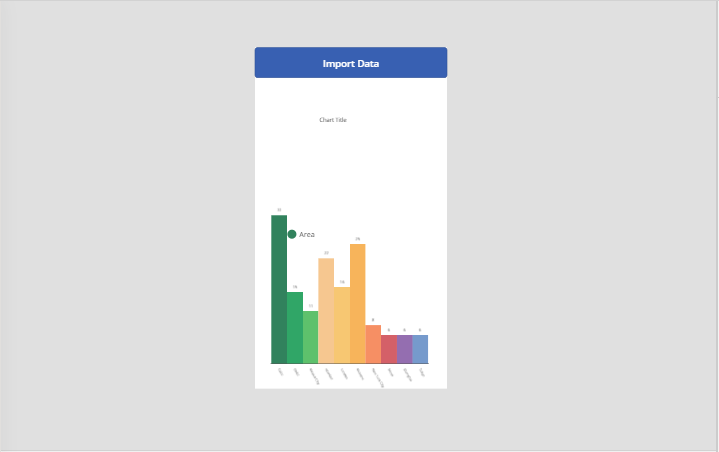
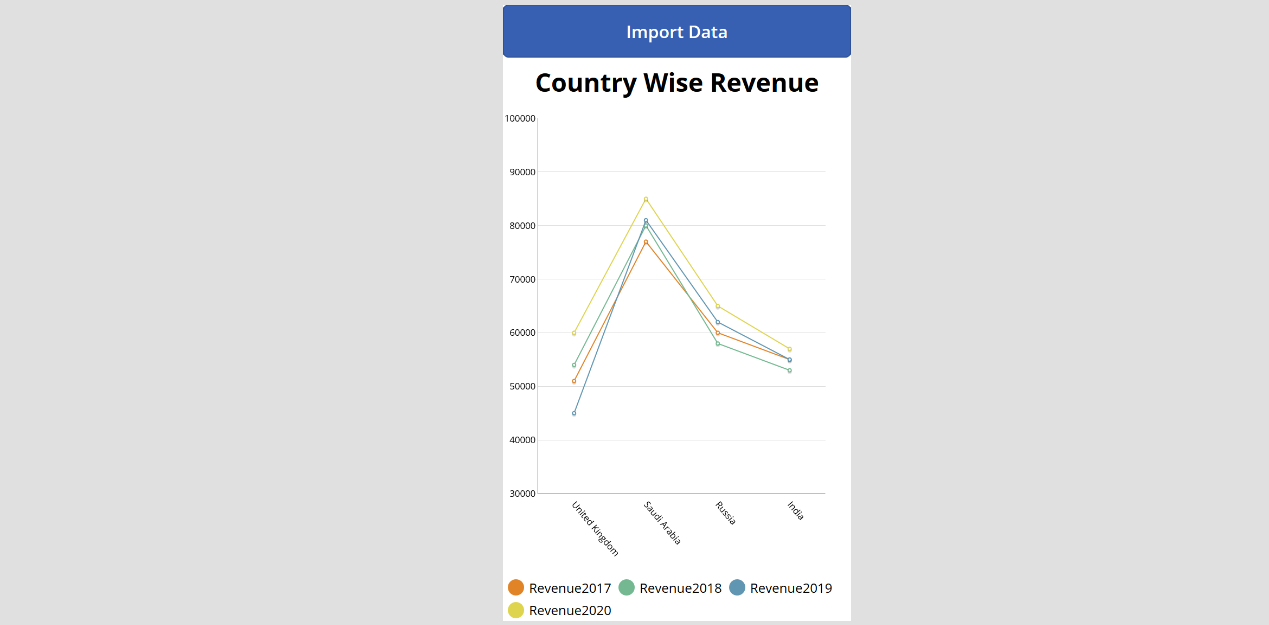
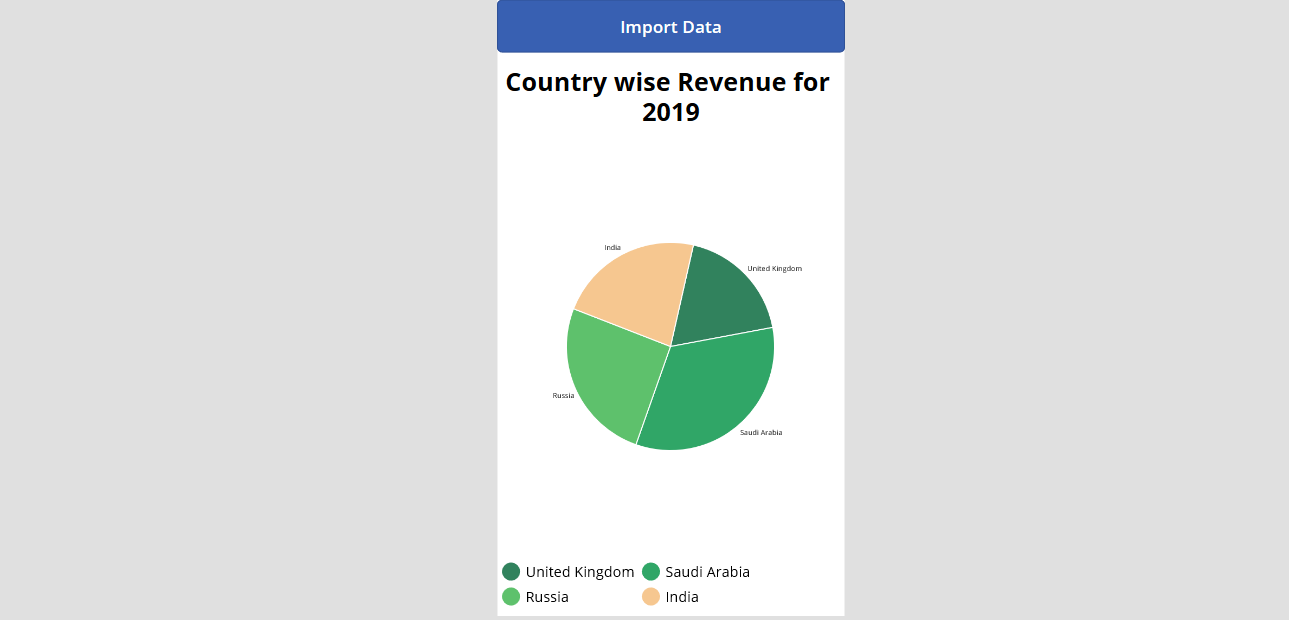
Charts are used for graphical representation of data. It can usually be read more quickly than the raw data. In PowerApps there are below types of charts:
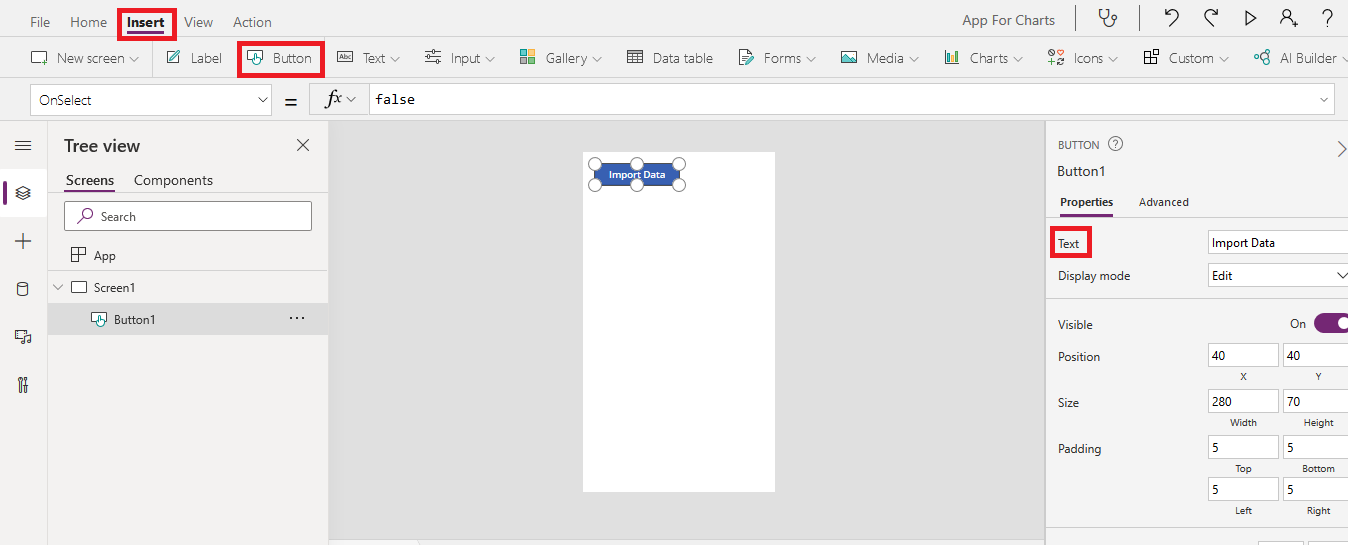
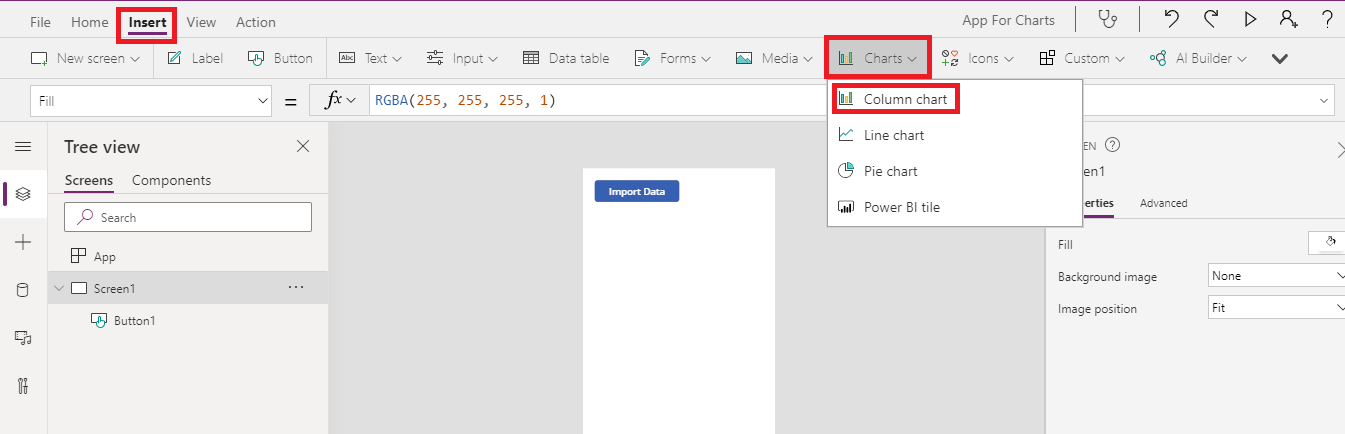
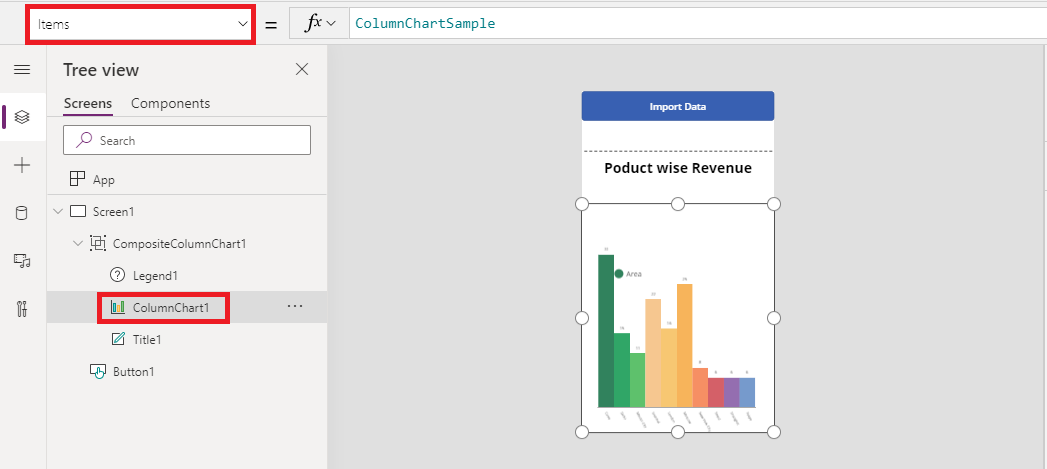
Below are the steps to work with Charts control in PowerApps:
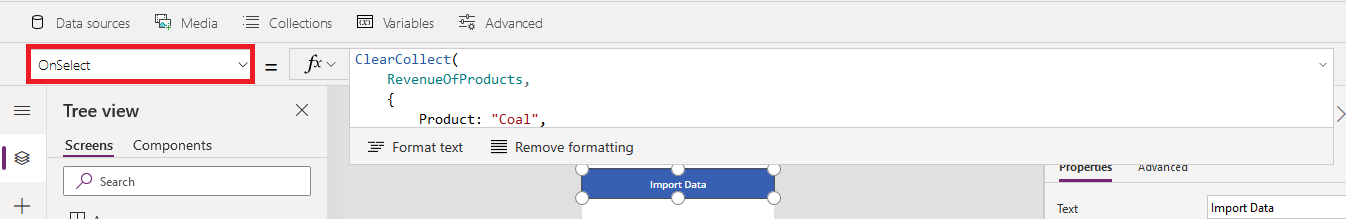
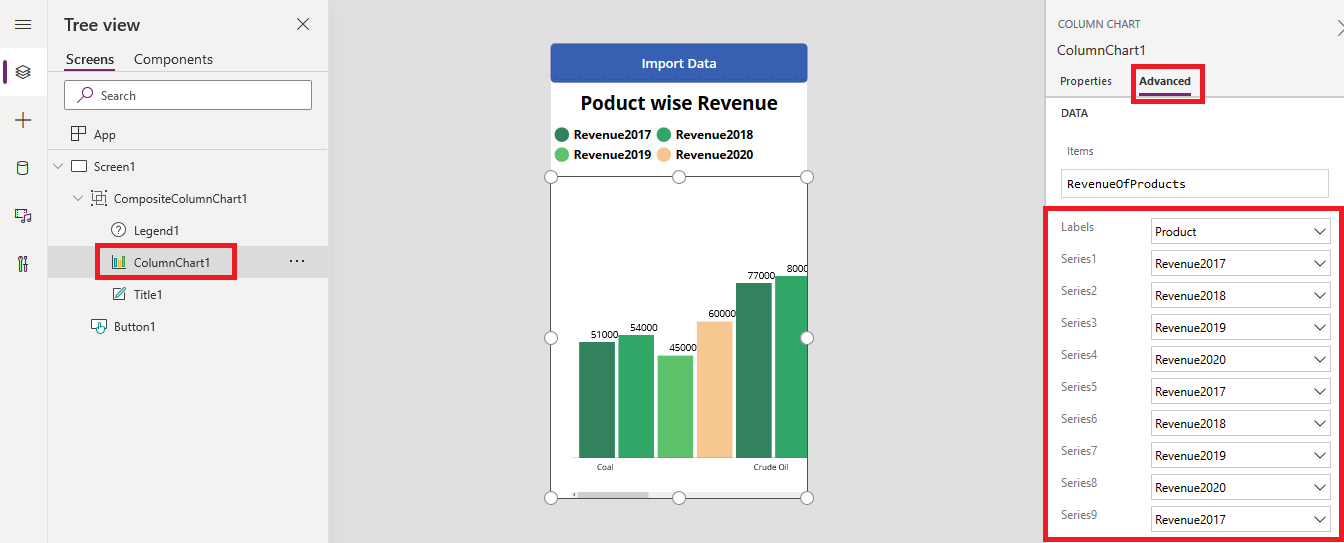
Write the below code in OnSelect property:
ClearCollect(
RevenueOfProducts,
{
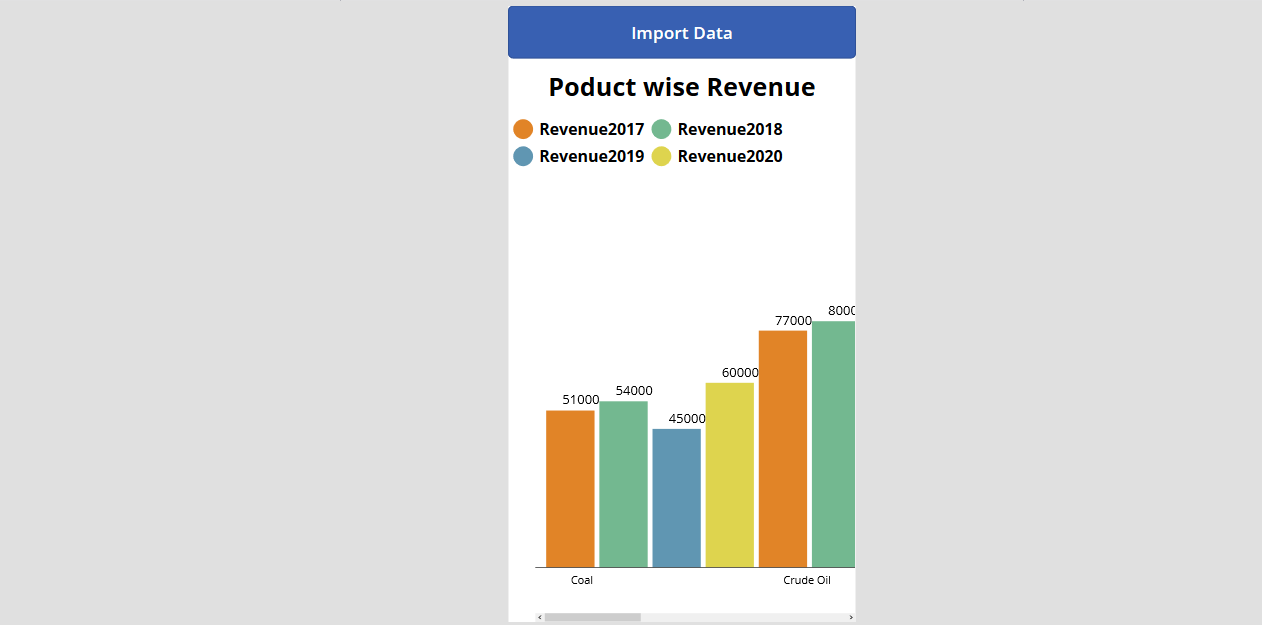
Product: "Coal",
Country: "United Kingdom",
Revenue2017: 51000,
Revenue2018: 54000,
Revenue2019: 45000,
Revenue2020: 60000
},
{
Product: "Crude Oil",
Country: "Saudi Arabia",
Revenue2017: 77000,
Revenue2018: 80000,
Revenue2019: 81000,
Revenue2020: 85000
},
{
Product: "Diamond",
Country: "Russia",
Revenue2017: 60000,
Revenue2018: 58000,
Revenue2019: 62000,
Revenue2020: 65000
},
{
Product: "Cotton",
Country: "India",
Revenue2017: 55000,
Revenue2018: 53000,
Revenue2019: 55000,
Revenue2020: 57000
}
)

I hope this will help you!!
ATM Inspection PowerApp to ease ATM inspection and report generation process.
https://powerapps.microsoft.com/en-us/partner-showcase/inkey-solutions-atm-inspection/
Insert data into Many-to-Many relationship in Dynamics CRM very easily & quickly, using the Drag and drop listbox.
http://www.inkeysolutions.com/what-we-do/dynamicscrmaddons/drag-and-drop-listbox
Comply your Lead, Contact, and User entities of D365 CRM with GDPR compliance using the GDPR add-on.
https://www.inkeysolutions.com/microsoft-dynamics-365/dynamicscrmaddons/gdpr
Create a personal / system view in Dynamics CRM with all the fields on the form/s which you select for a particular entity using the View Creator.
http://www.inkeysolutions.com/what-we-do/dynamicscrmaddons/view-creator
INKEY is your solution partner.
Our focus is to deliver you in-time intelligent innovative solutions ("key") for the problems in hand. Maintaining a quality standard right from the inception of a project is our top most priority.
Our team of talented professionals will execute your projects with dedication and excellence. We take ownership and accountability for the effort that goes into meeting our client’s needs.
Years of experience and proven success of delivering innovative custom solutions.


© All Rights Reserved. Inkey IT Solutions Pvt. Ltd. 2024


Leave a Reply