
There are times when you don’t want null values to be displayed in the matrix, or only those items which has data in the table in Power BI.
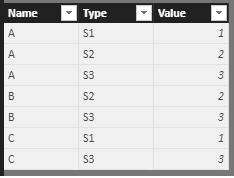
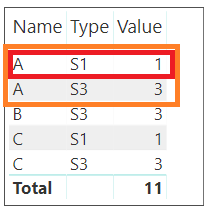
Suppose we have data as in the below image:
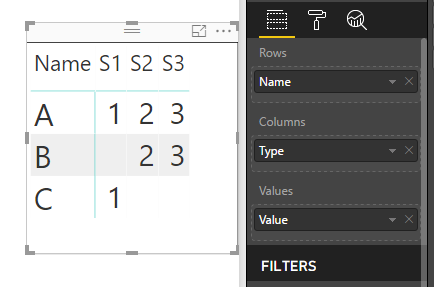
And we want those names which has all the three types, S1, S2 and S3.
Simply plotting the data as in the image won’t work.
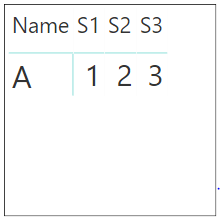
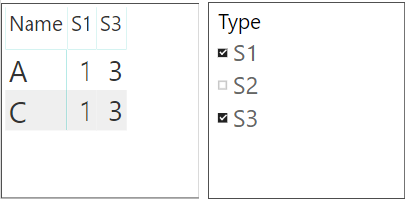
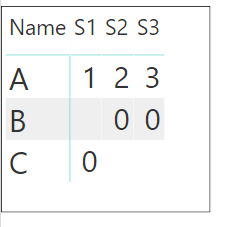
But we want the data to be displayed as follows:
Or, suppose I want to see data present only in type S1 and S3.
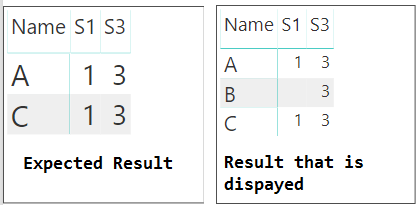
Hence, I don’t want results to be shown that has only either of the selected types. In this case, B.
So, how do we achieve this?
Microsoft Fabric, Power BI, Microsoft Business Intelligence, SQL Server, and Business Central. By the power of these services, from advanced analytics to seamless business integration, we’ve got the expertise you need to optimize operations and drive growth. Harness the potential of your data infrastructure with our comprehensive suite of solutions.
I tried a couple of approaches to achieve it that didn’t work, however was successful achieving it.
For example :
I assumed that this will be achieved just by filtering the value when it is not blank.
I realized that it won’t be achieved just by filtering ‘Value is not blank‘.
![]()
Hence, I tried another approach.
Let us try a measure and see whether it leads to our specified destination.
IgnoreNullValues = IF (
                        CALCULATE(DISTINCTCOUNT(Table[Type]), ALLSELECTED(Table[Type]))
                        = COUNTROWS(ALLSELECTED(Table[Type])),
                        MIN(Table[Value])
                       )
Let’s plot this measure instead of Value in the matrix.
And, bingo..we got the expected result. It displays only those names which has the selected types.
Let’s split this measure into two measures to see how this measure works:
FirstMeasure = CALCULATE ( DISTINCTCOUNT ( Table[Type] ), ALLSELECTED ( Table[Type] ) )
The above measure calculates the distinct count of the selected types
and
SecondMeasure = COUNTROWS(ALLSELECTED(Table[Type]))
This measure calculates how many rows of data is available for the particular selected types
Please note, this measure calculates MIN(Table[Value]) only when FirstMeasure=SecondMeasure.
Let’s plot all the visuals and understand the working:
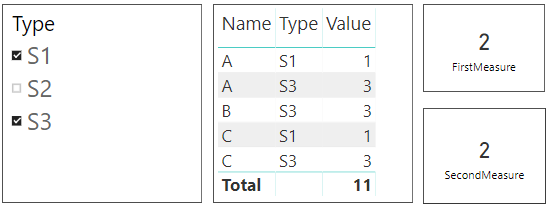
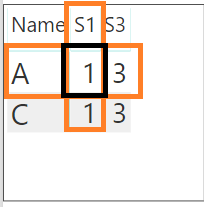
Here, Type is selected as S1 and S3.
So, FirstMeasure will filter the table as per selected Type(i.e. S1 and S3) and will count ‘Type’ distinctively.
We have table visual to see how it will be filtered. FirstMeasure will count Type in the filtered table(as below):
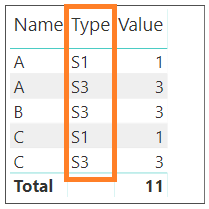
So , this will result as 2.
SecondMeasure will countrows according to the selected Type contexually, i.e. for Name=A , it will count rows in the filtered table by selected Type and will return MIN(Value).
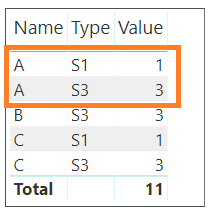
Hence, for Name=A and Type=S1 , Min(Value)=1.
Hence,
Let’s see how it works when there are no values for the selected Type.
Here, for B, there is no value for S1.
So, for Name=B, FirstMeasure would result to 2 but SecondMeasure will result to 1 as it contains value for only S3.
Hence, it would return nothing as FirstMeasure is not equal to SecondMeasure.
Here, it really doesn’t matter if we use MIN,MAX or anything. Any aggregate function would work because it returns only single value when calculating the value.
Note that this works only when NO value is specified when the condition is false.
So, if we specify value ‘0’ when FirstMeasure is not equal to SecondMeasure, i.e. if the condition returns false, it would show data with value as ‘0’ as follows:
IgnoreNullValues = IF ( CALCULATE(DISTINCTCOUNT(Table[Type]), ALLSELECTED(Table[Type]))
                        = COUNTROWS(ALLSELECTED(Table[Type])),
                        MIN(Table[Value]) , 0 )
Thus, null values can be removed from the matrix with the help of this measure.
Happy DAX-ting!
INKEY is your solution partner.
Our focus is to deliver you in-time intelligent innovative solutions ("key") for the problems in hand. Maintaining a quality standard right from the inception of a project is our top most priority.
Our team of talented professionals will execute your projects with dedication and excellence. We take ownership and accountability for the effort that goes into meeting our client’s needs.
Years of experience and proven success of delivering innovative custom solutions.


© All Rights Reserved. Inkey IT Solutions Pvt. Ltd. 2024


very y\thanks for your solutuion, BUt how can we use it?!!!
Hello, can you please provide more explanation as to how you want to use it? Generally, I can say that you can use this logic in measures, but more information would be better.
Hey!
Thanks for your solution
This is very close to my case and I think I have a little problem can you help me?
In my case the Value is 4 columns (general, precentage, Accounting, Text)
And my lines is “שם הרשות”
how i can Attached Photo her?
Hello, you can provide your details by mailing support@inkeysolutions.com. We can then look further about the issue.
I’m only a novice, but what’s wrong with using a measure like…
ShowCondition =
if(and(
ISBLANK([S1]),
ISBLANK([S2]),
ISBLANK([S3])),
0,1)
where you put the condition on the visual/page/report? Is this more performance heavy?
This measure will give you zero value whenever all the three values are blank. Hence, it first checks the condition and then returns either 0 or 1. It depends on your data to say if this is more performance heavy. However it depends on your requirement if you would like to see zero where all the 3 values are blank.