
We all know how the basic components in Power BI should work. But as soon as you think that now you have reached the stage where you know almost all about Power BI, it leaves you open-mouthed.
Recently, I came across a very weird issue – “A BLANK row getting added to the Table from nowhere” and today I will share the logic behind this magic with the below example.
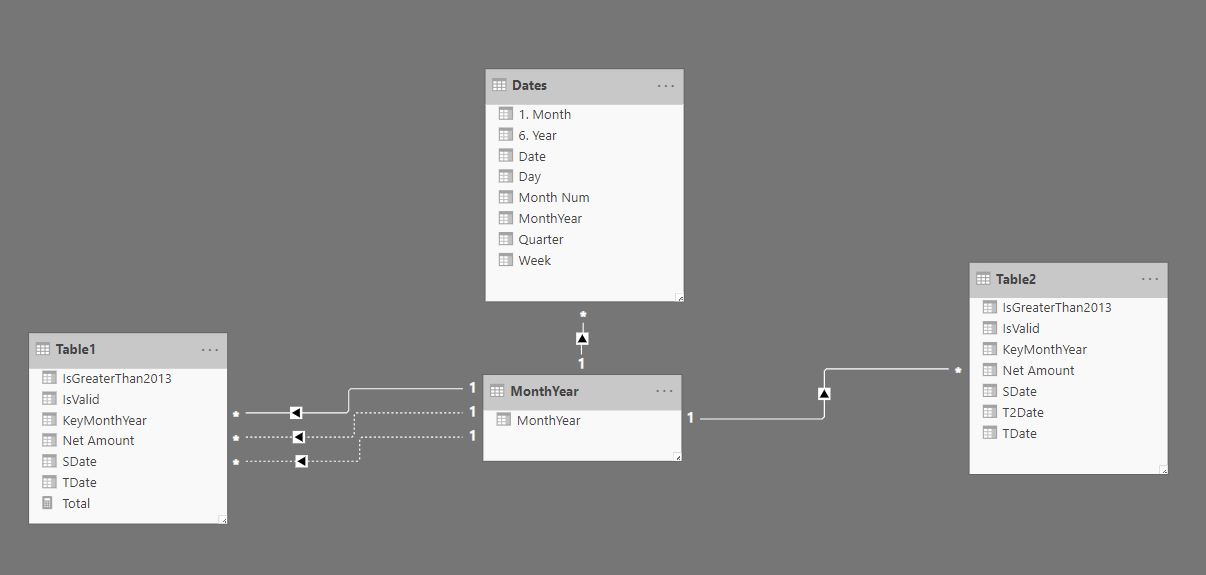
I had the following data model where the MonthYear column from the MonthYear table is actively related to the SDate column of Table1 & Table2 and inactively related to the KeyMonthYear column and Tdate column of Table1.
In addition to this, I also had the following measure:
Total =
VAR SelectedMonth =
    IF (
        ISFILTERED ( Dates[1. Month] ),
        SELECTEDVALUE ( Dates[Month Num] ),
        IF (
            ISFILTERED ( Dates[Quarter] ),
            MAX ( Dates[Month Num])
        )
    )
VAR SelectedYear =
    SELECTEDVALUE ( Dates[6. Year] )
VAR EndDate =
    DATE ( SelectedYear, SelectedMonth, 1 )
VAR TotalAmount =
    CALCULATE (
        SUM ( Table1[Net Amount] ),
        USERELATIONSHIP(MonthYear[MonthYear],Table1[KeyMonthYear]),
        FILTER (
            ALL( Dates),
            Dates[Date] <= EndDate
        )
    )
RETURN
   TotalAmount
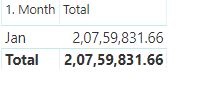
Next, I plotted this measure against the Month name from the Date table as follows:
Now, for some reason, I had to create an inactive relationship between Dates[Date] and Table2[TDate].
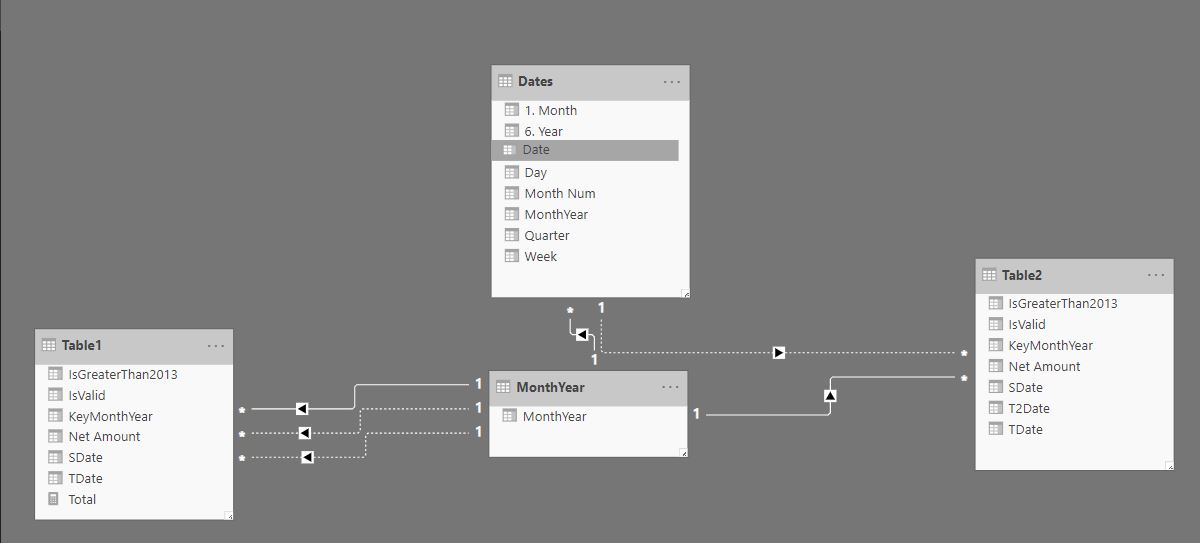 But as soon as I created the inactive relationship between these two tables, I found a very weird behavior. My measure brought a different value altogether. See below:
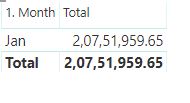
Did you notice the difference between the values of the measure?
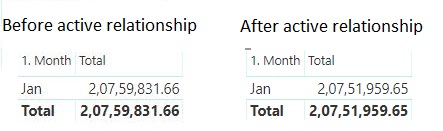
I was puzzled because the measure takes consideration of fields of only Table1 and MonthYear. It had nothing to do with Table2. Additionally, an inactive relationship is created, which shouldn’t affect the measure.
After seeking help from the Power BI Geniuses using various community forums, we concluded to the following reason behind such behavior –
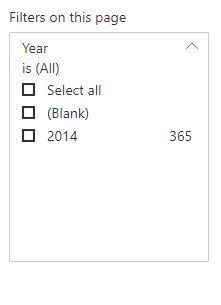
The key thing to note here is that when we attach Table2 to Dates, since Table2 contains TDate values that don’t match to any Date[date], this creates an extra row in Dates with a blank date, which we can notice in the filter on Year when that relationship exists (active or inactive). This is by design to respect the relationships between the tables.
However, filtering out that blank in the Year filter would work. But in our case, it wouldn’t, because in our measure we have used ALL(Dates) to strip all filtering done on that table.
We were guided with one solution: replace ALL with ALLNOBLANKROW, and we got the expected result.
Results with no filter and with two measures, one using ALL and one using ALLNOBLANKROW are as follows:
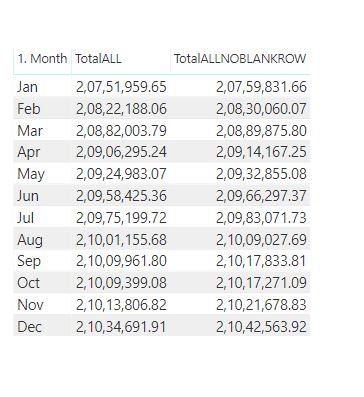
Notice that every row in the ALL column has been reduced by -7,872.01, i.e. the sum of all the Net Amount values that don’t match to any dates in the Dates table.
![]()
Thus, we learned how such basic behavior is unknown to many of us!
INKEY is your solution partner.
Our focus is to deliver you in-time intelligent innovative solutions ("key") for the problems in hand. Maintaining a quality standard right from the inception of a project is our top most priority.
Our team of talented professionals will execute your projects with dedication and excellence. We take ownership and accountability for the effort that goes into meeting our client’s needs.
Years of experience and proven success of delivering innovative custom solutions.


© All Rights Reserved. Inkey IT Solutions Pvt. Ltd. 2024


Leave a Reply