Home / Case Studies / Migration of data from multiple sources and creating Power BI Reports

Education

Migration of data from multiple sources and creating Power BI Reports

A nationwide network of learning centers operates under an organization, generating surplus data stored across five different sources tailored to specific requirements. Utilizing this data, the organization aims to develop comprehensive Power BI Reports that are both robust and user-friendly, ensuring easy comprehension and usability.

The Challenge

What Was Holding the Business Back?

Business data was distributed across multiple disconnected sources, making reporting complex, time-consuming, and difficult to maintain.

Scattered Data Critical business information was spread across five independent data sources with different structures.
Complex Reporting Preparing data for reporting required significant manual effort and extensive data transformation.
Limited Visibility Decision-makers lacked a centralized view of organizational performance across learning centers.
Operational Overhead Managing multiple tools and disconnected data pipelines increased maintenance effort and costs.
Objective

What We Set Out to Achieve

Create a unified Microsoft Fabric data platform that consolidates information from multiple sources, automates data transformation, and delivers interactive Power BI reports for organization-wide decision-making.
Our Approach & Solution

How We Delivered Results

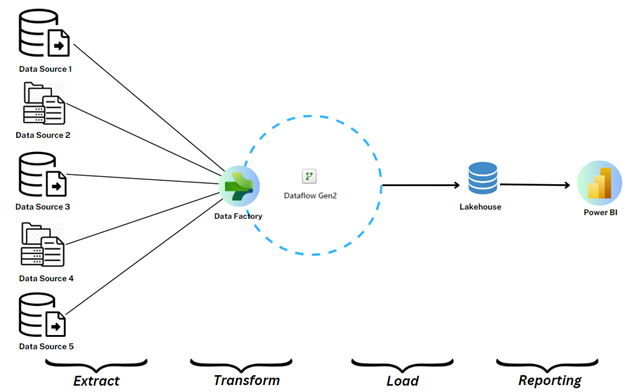
Built a complete end-to-end analytics solution using Microsoft Fabric to extract, transform, store, and visualize enterprise data through interactive Power BI dashboards.

01
Data Extraction
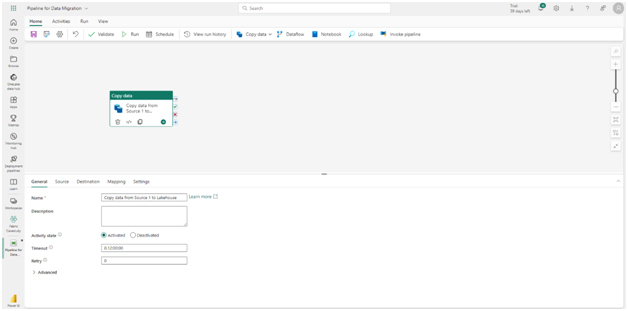
Used Data Factory pipelines to collect and consolidate data from five different business systems.
02
Data Transformation
Applied Dataflow Gen2 to cleanse, standardize, and prepare datasets for reporting.
03
Lakehouse Storage
Stored transformed data in Microsoft Fabric Lakehouse as a centralized and scalable data repository.
04
Power BI Insights
Developed interactive dashboards that enabled stakeholders to monitor performance and make informed decisions.
Unified Platform
Consolidated multiple data sources into a single Microsoft Fabric ecosystem for simplified management.
Automated Pipelines
Implemented automated ETL workflows to ensure reliable and consistent data availability.
Interactive Reports
Delivered intuitive Power BI dashboards with rich visualizations and drill-down capabilities.
Cost Optimization
Reduced licensing and infrastructure costs by leveraging the integrated Microsoft Fabric platform.
Results & Impact

The Outcome

The Microsoft Fabric implementation centralized enterprise data, streamlined analytics workflows, and empowered stakeholders with accurate, interactive business insights while reducing operational complexity.

One
Data Hub
Less
IT Costs
Easy
Access
Lean
Operations
Conclusion

The Bigger Picture

The Microsoft Fabric solution transformed fragmented enterprise data into a centralized, scalable analytics platform. By integrating Data Factory, Dataflow Gen2, Lakehouse, and Power BI, the organization streamlined data management, automated transformation processes, and delivered intuitive dashboards that improved visibility, reduced operational costs, and enabled confident, data-driven decision-making across its nationwide learning centers.

Additional Details

The Solution:

The foundation of a report is the data used in it. In this case, the data resides at five different sources in an unorganized manner.

So, the first step is to get the data from those five sources. The process is called extraction.

Extraction in Microsoft Fabric is possible with Data Factory.
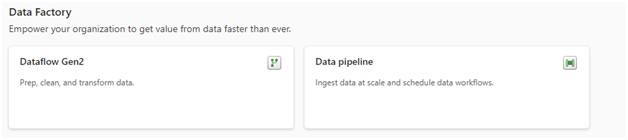

Data Pipeline for Migrating the Data
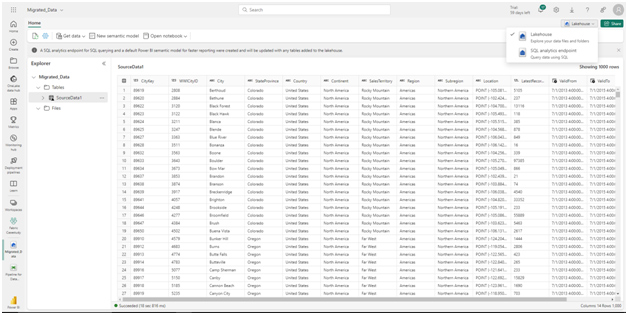

Migrated Data Stored in Lakehouse

As mentioned previously the data is stored in an unorganized manner. As we’ve got the data the next step is to organize it according to the report requirements. This process is called Transformation.

Transformation can be easily done in Microsoft Fabric using Dataflow Gen2, which is an integral element of Data Factory.
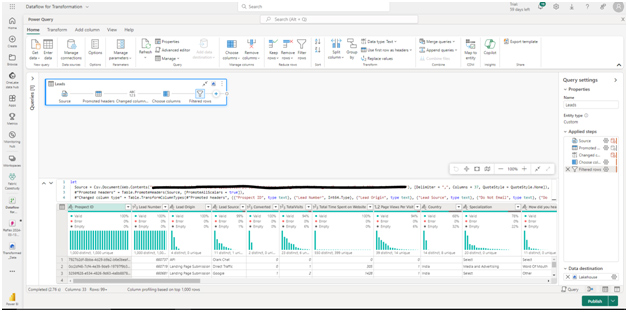

Transforming Data using DataFlow Gen2

Now, as we have created a flow of data from the sources, we’ll need to store it somewhere. This process is called Load (Loading the data).

Again, Microsoft Fabric comes as a savior by bringing Lakehouse in the plate. Lakehouse is used to store the transformed data.
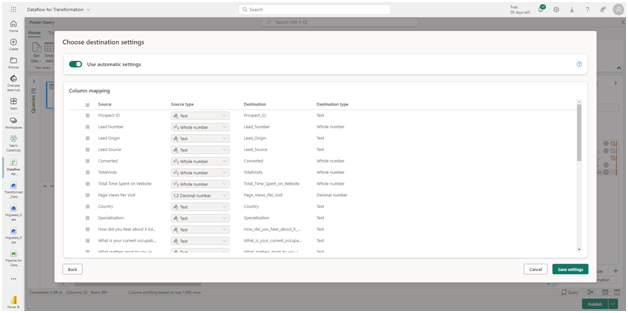

Storing Transformed Data in Lakehouse

This data is then fetched in Power BI which is used to Create interactive Reports from which concerned stake holders get a clear idea and can take informed actions.
Benefits:

  • Easy to manage Data at one place.
  • Cost effective as we don’t have to get license of other components like Azure Data Factory, SQL Server etc.
  • Streamlined process.
  • Easy to Access and User friendly.
  • Less number of Human Resources needed.
Ready to Transform Your Business with Data?
Connect with our team and let's build your intelligence story.
Chat on WhatsApp Call Us Now