Home / Case Studies / Scorecard, Fin. Analytics Dashboard for Medical Courier Company

Healthcare Logistics

Scorecard, Fin. Analytics Dashboard for Medical Courier Company

The client wanted to automate their Performance Scorecards and Financial Dashboards in Power BI. The requisite data sets were set across multiple data sources such as application database, SharePoint, and Excel files. We also had to fetch data from third-party APIs.

The Challenge

What Was Holding the Business Back?

Business-critical operational and financial data was distributed across multiple systems, making performance tracking, reporting, and decision-making slow, manual, and prone to errors.

Scattered Data Operational and financial data resided across databases, SharePoint, Excel files, and external APIs without centralized reporting.
Manual Reporting Excel-based reporting consumed valuable time and delayed the availability of business insights.
Data Integration Combining data from multiple internal and external sources required significant manual effort.
Delayed Decisions Weekly reporting cycles limited the organization's ability to respond quickly to operational and financial changes.
Objective

What We Set Out to Achieve

Build an automated analytics platform that consolidates operational and financial data from multiple sources into Power BI dashboards, enabling timely performance monitoring and informed business decisions.
Our Approach & Solution

How We Delivered Results

Implemented an end-to-end Azure analytics solution that automated data ingestion, centralized reporting, and delivered interactive Power BI scorecards for operational and financial performance.

Data Automation
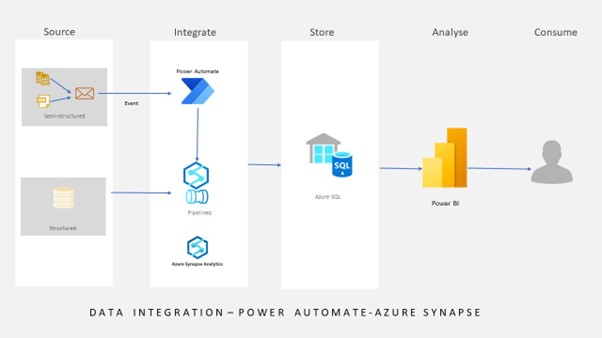
Automated Excel file processing using Power Automate to capture and process data immediately upon email receipt.
Data Integration
Integrated application databases, SharePoint, Excel files, and third-party APIs through Azure Synapse Analytics.
Centralized Storage
Consolidated cleansed data into Azure SQL Data Warehouse to establish a single source of truth.
Executive Dashboards
Developed interactive Power BI scorecards and financial dashboards to monitor KPIs, operational performance, and business trends.
Workflow Automation
Reduced manual intervention by automating Excel processing and scheduled data refreshes.
Multi-Source Analytics
Unified information from databases, SharePoint, APIs, and spreadsheets into a single reporting platform.
Daily Reporting
Converted weekly reporting processes into daily dashboard updates for timely business insights.
Executive Scorecards
Provided interactive scorecards enabling leadership to monitor operational and financial performance from one dashboard.
Results & Impact

The Outcome

The automated analytics platform eliminated manual reporting bottlenecks, accelerated data availability, and provided leadership with timely operational and financial insights through centralized Power BI dashboards.

Daily
Report Refresh
Auto
Excel Processing
Sync
Data Integration
Score
KPI Tracking
Conclusion

The Bigger Picture

The Performance Scorecard and Financial Analytics solution modernized the client's reporting ecosystem by automating data collection, integrating multiple enterprise data sources, and delivering centralized Power BI dashboards. The solution improved reporting efficiency, reduced manual effort, increased reporting frequency, and empowered business leaders with timely, data-driven operational and financial insights.

Additional Details

Scorecard & Financial Analytics Dashboard for a Medical Courier Company
Ready to Transform Your Business with Data?
Connect with our team and let's build your intelligence story.
Chat on WhatsApp Call Us Now