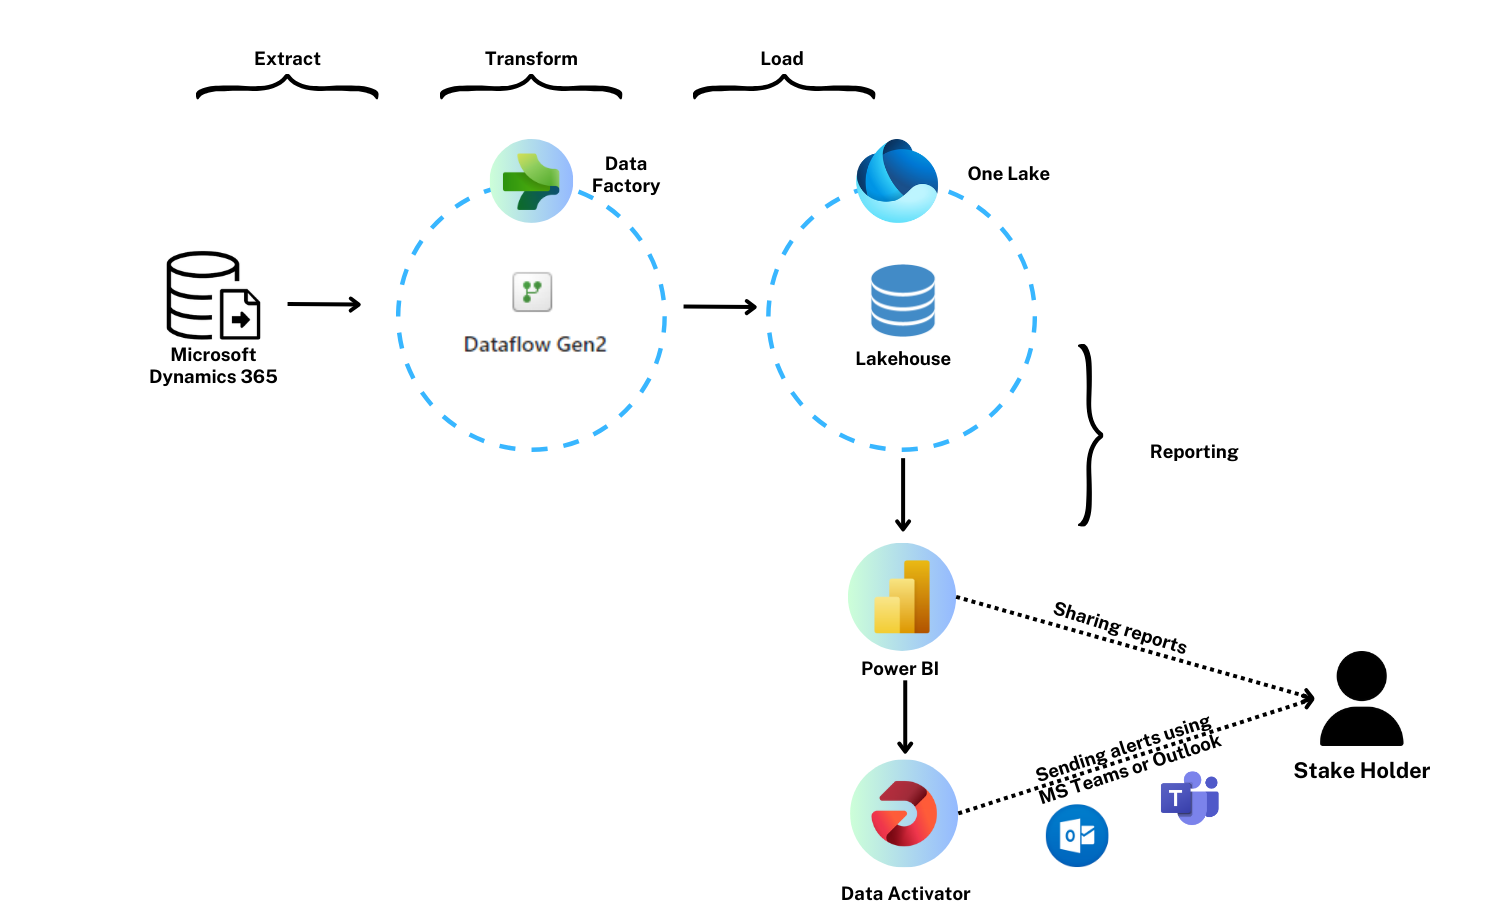
To make a Power BI report first-hand what we require is cleaned and well transformed data. To perform this Microsoft provides end to end solution as mentioned below.
In general, the Data Analytics project has three steps in common. Extract, Transform, and Load.
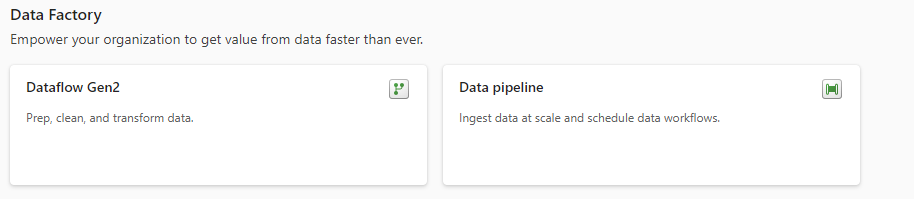
For Extracting and Transforming data MS Fabric provides its all new and Powerful component DataFlow Gen2 consisting of more than 100 connectors.
After connecting to the data source, we will transform it according to the business requirement using Data Factory’s component DataFlow Gen2.
.png)
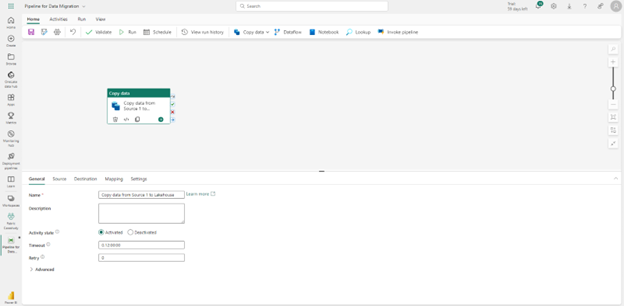
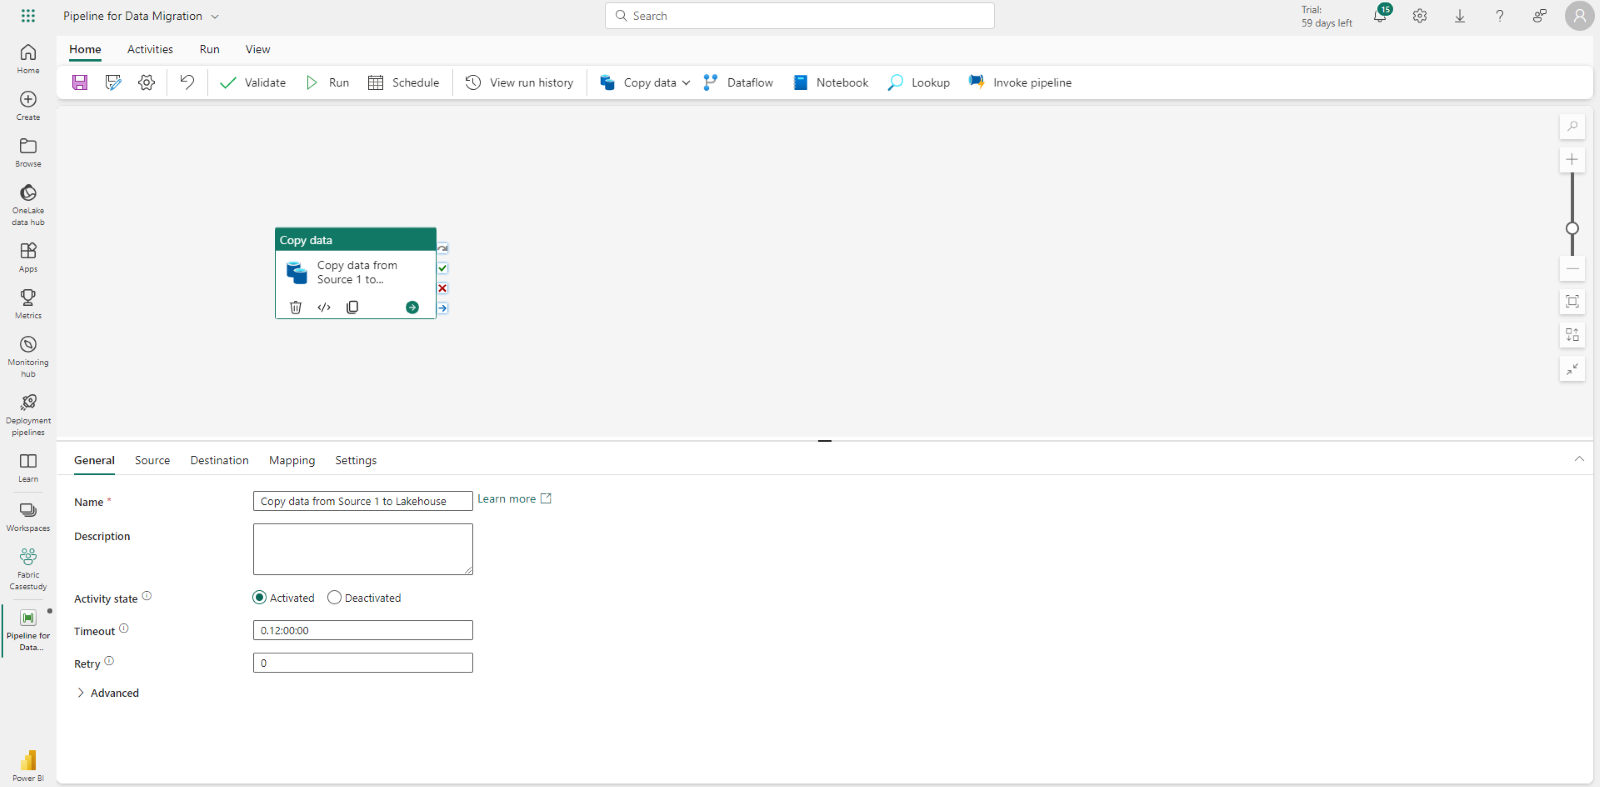
Data Pipeline for Migrating the Data
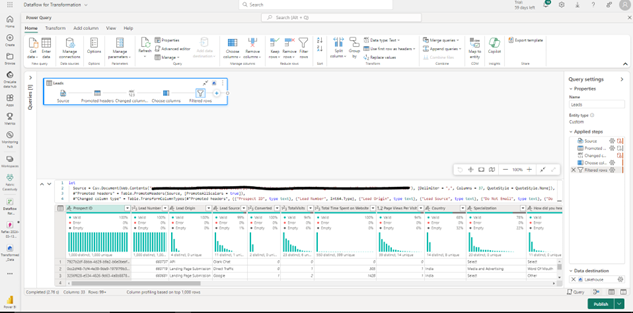
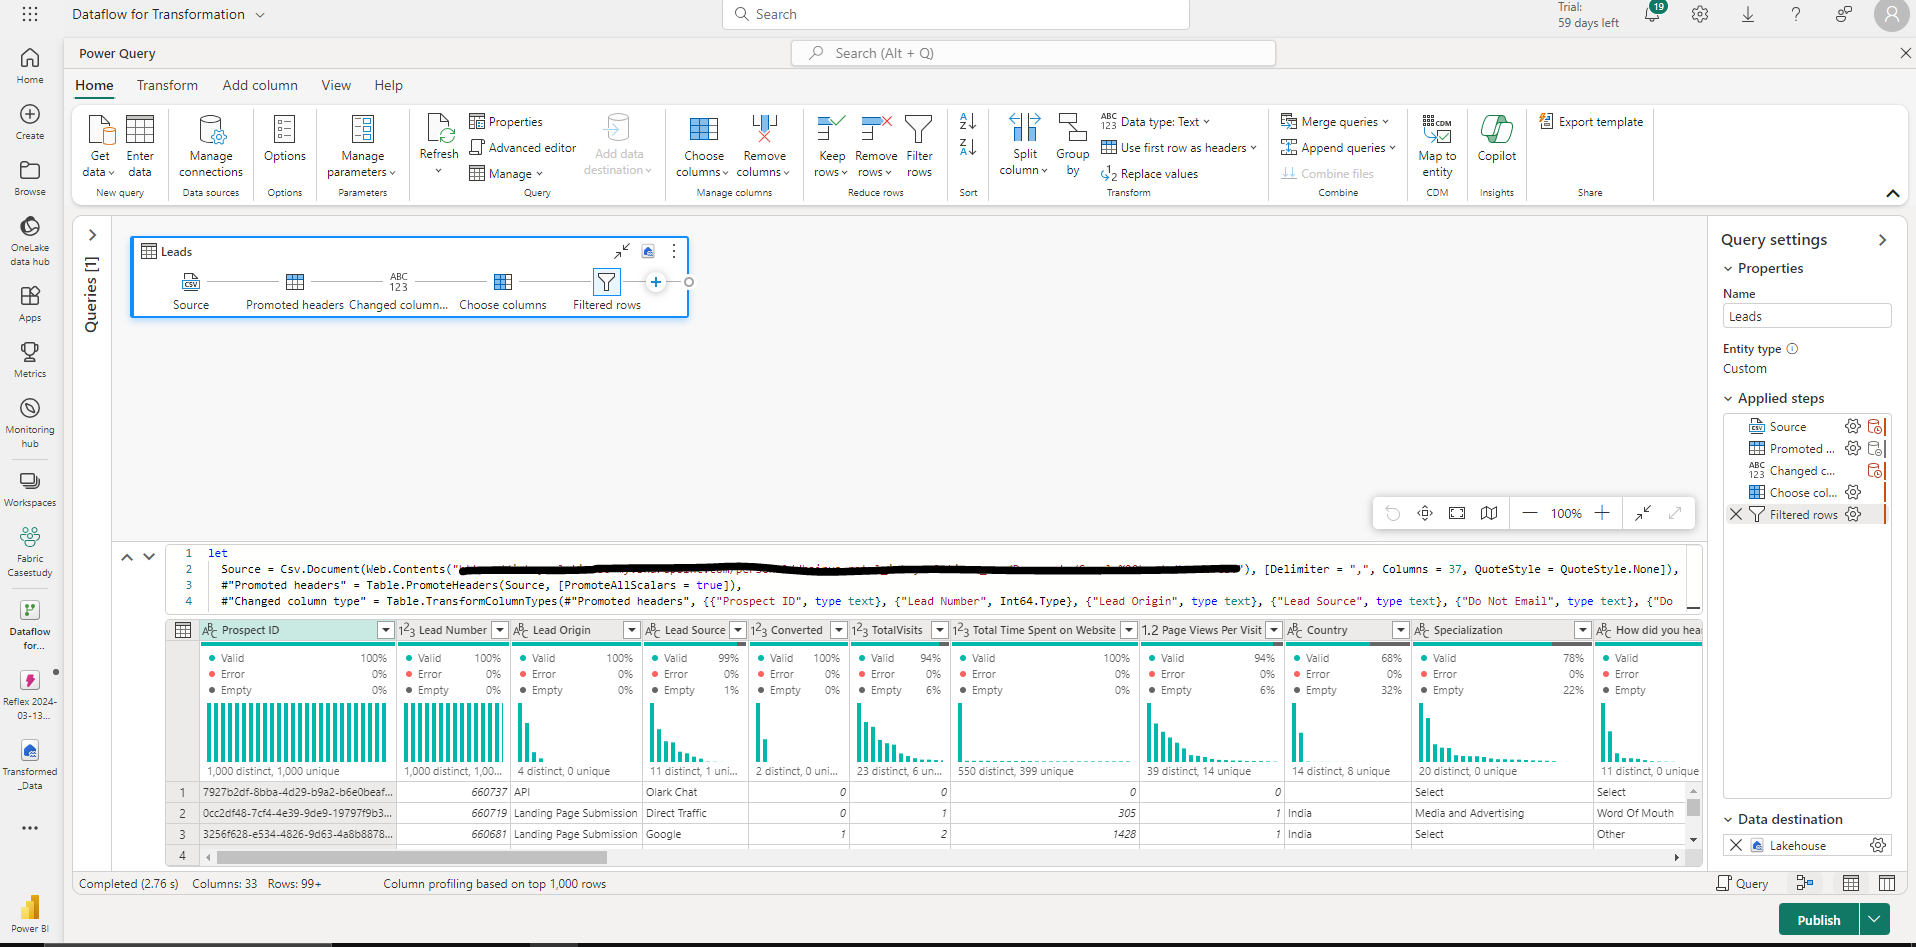
Transforming Data using DataFlow Gen2
Now we must store our data somewhere to access it for making Power BI Report. For this MS Fabric has Lakehouse in its feature.
Dataflow Gen 2 has the option to select the destination where we want to dump the transformed data. Using this, we dump the data into the Lakehouse.
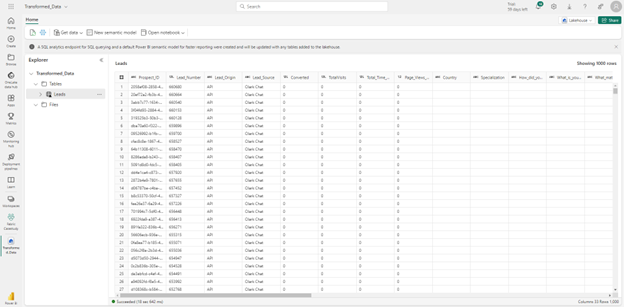
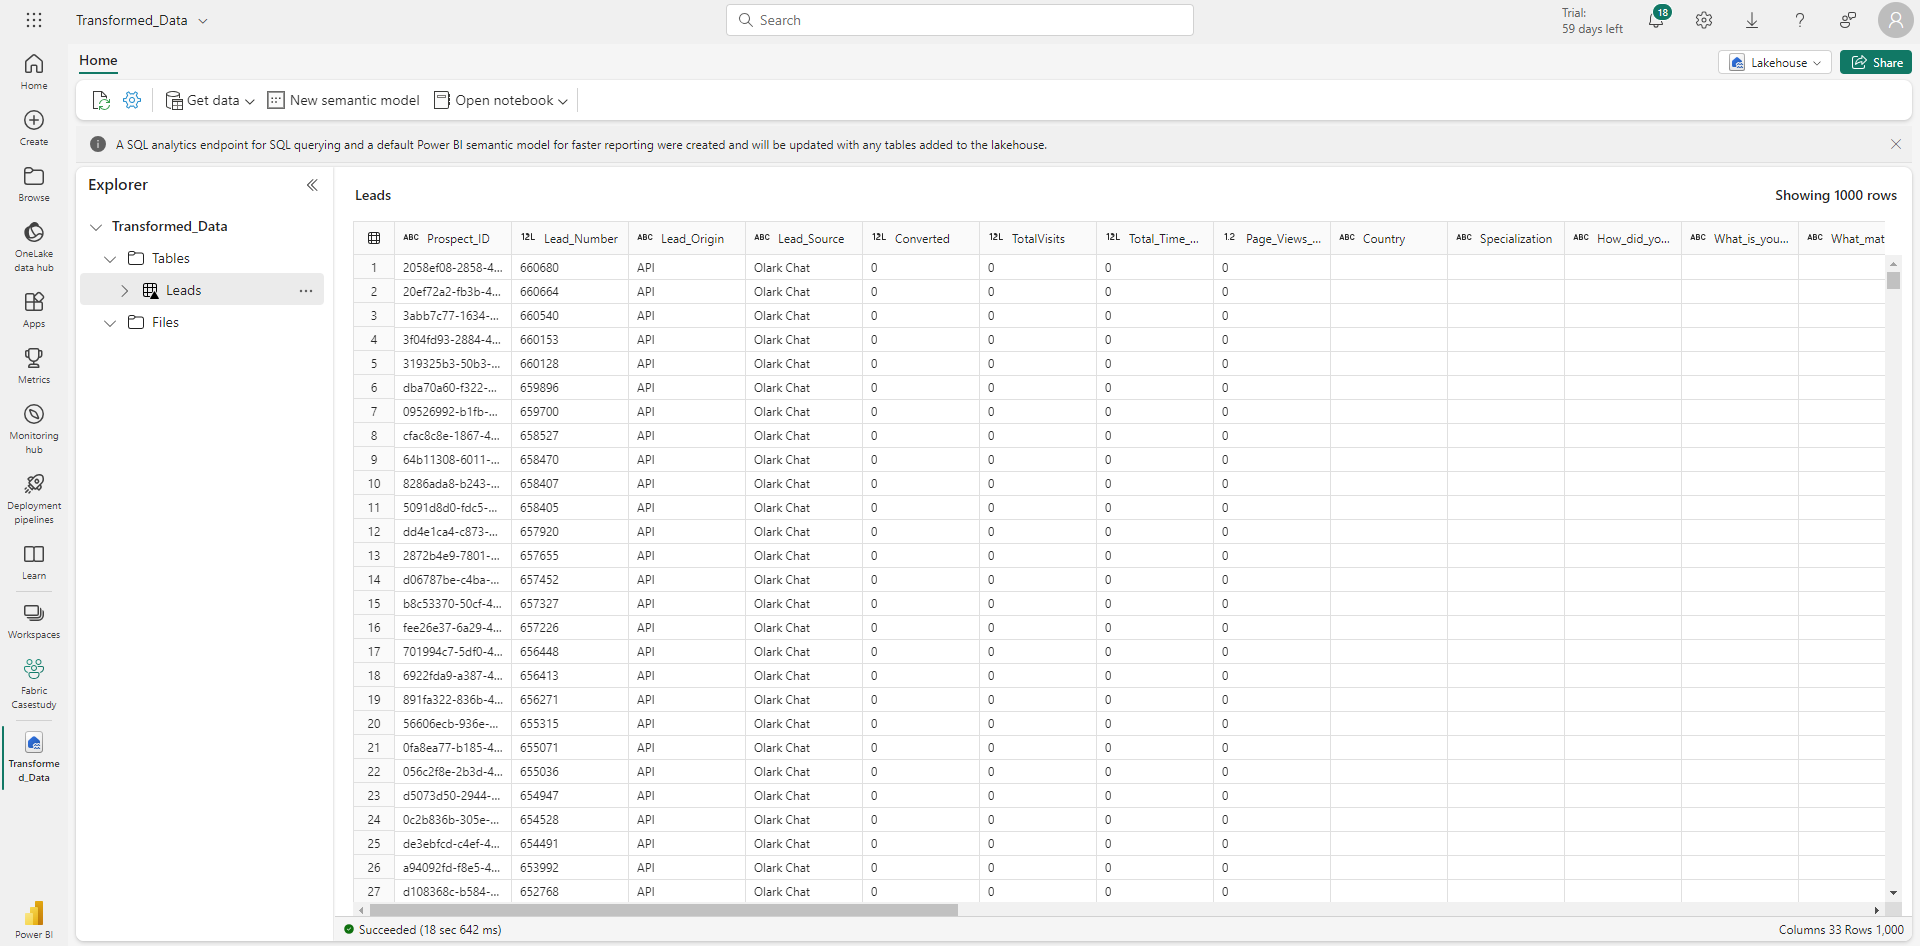
Stored Transformed Data in Lakehouse
Now we have the data as per our requirement from which we will create a Power BI report.
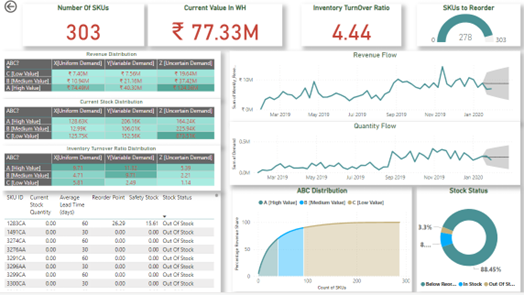
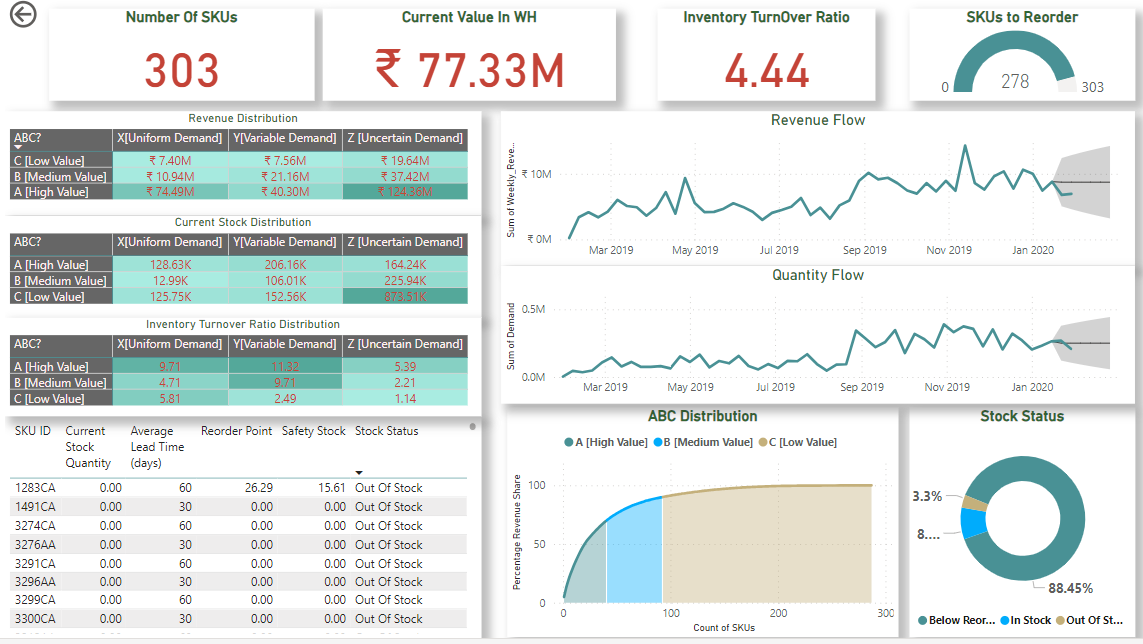
Power BI Report
Having our Power BI report ready with visuals and calculations displaying crucial information for business.
Now comes the final step of notifying the person concerned about the inventory status of the related store and sales generated in the past weeks. MS Fabric has its game-changing component for this as well, the Data Activator. Using Data Activator, we set an Action of Emailing and Sending Teams message triggered by threshold set by us. For example, if the inventory of any product is below 3 units, then the Manager should get the message making him aware of the situation or if there are some products which have not been sold in past week than also the Manager should be informed.
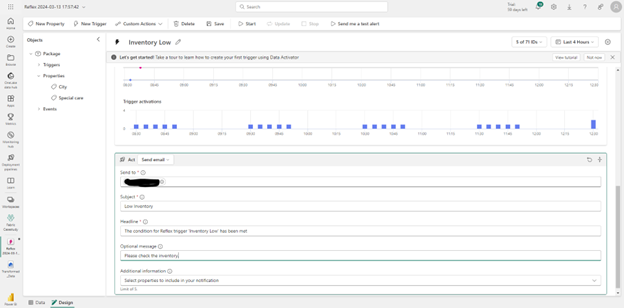
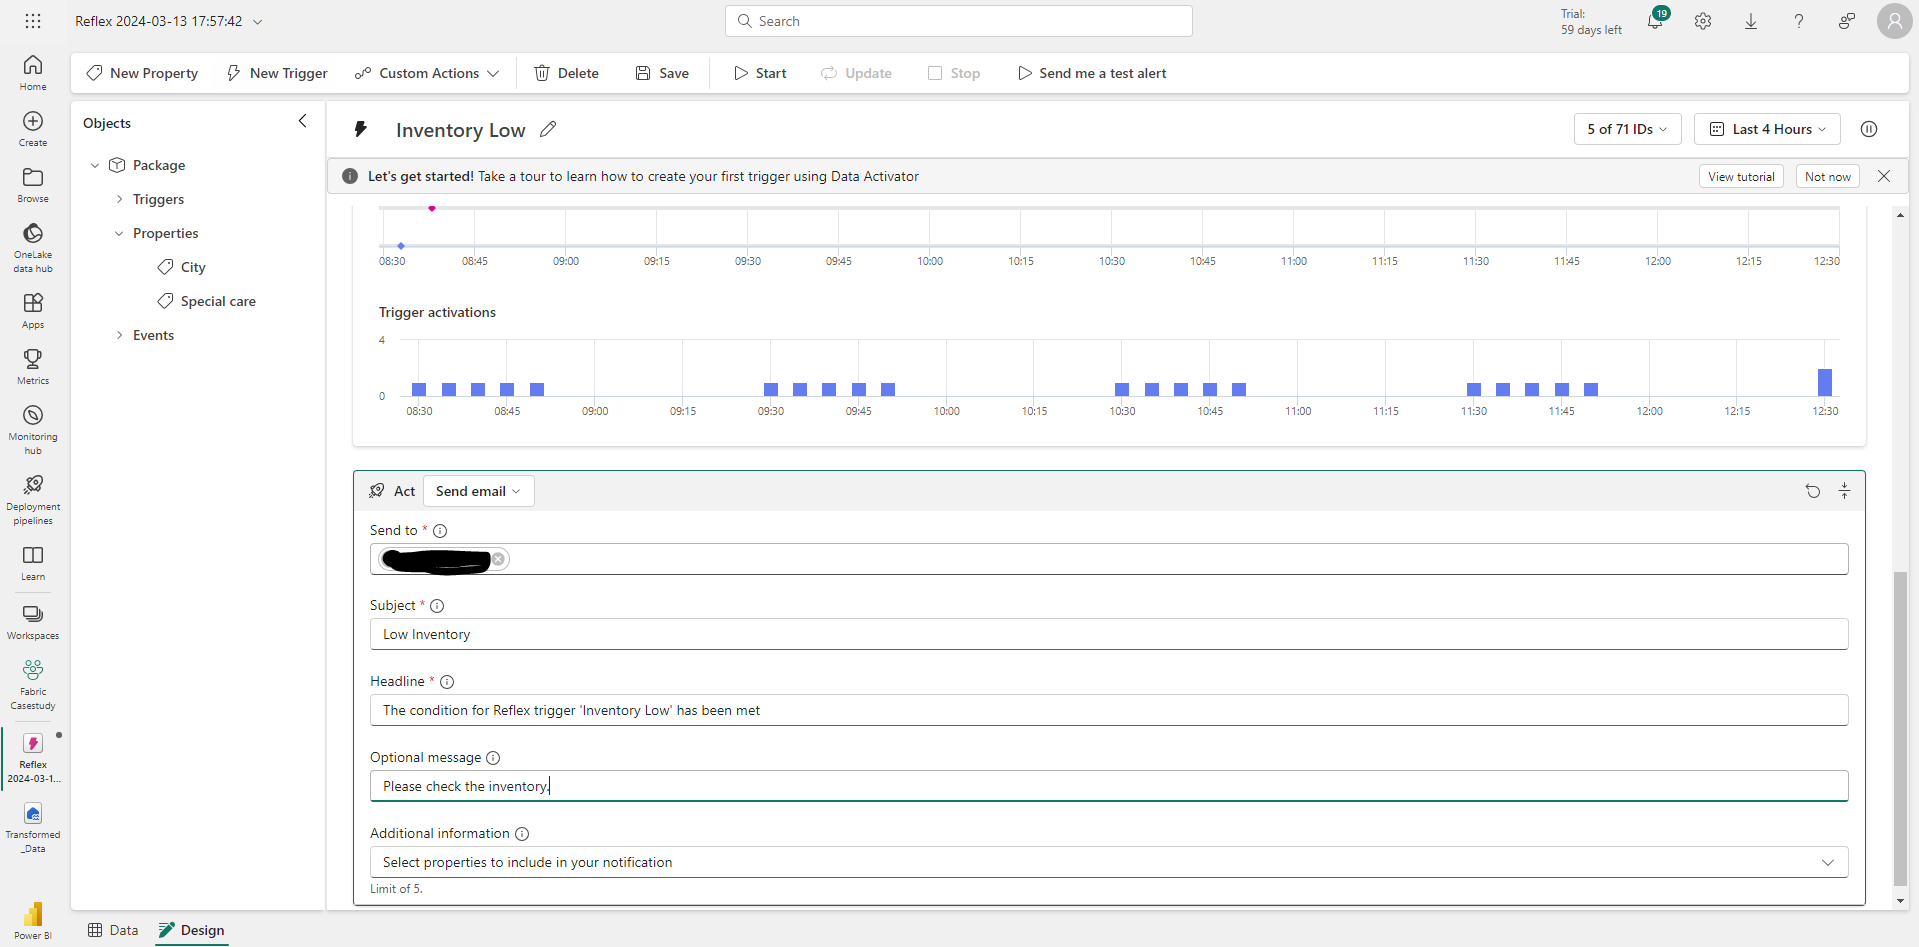
Configuring Reflex in Data Activator to send Alerts
Using all these components of Fabric our Architecture looks like below.