Logo
Case Studies Banner

Microsoft Power BI Consulting

Country Fair Analysis


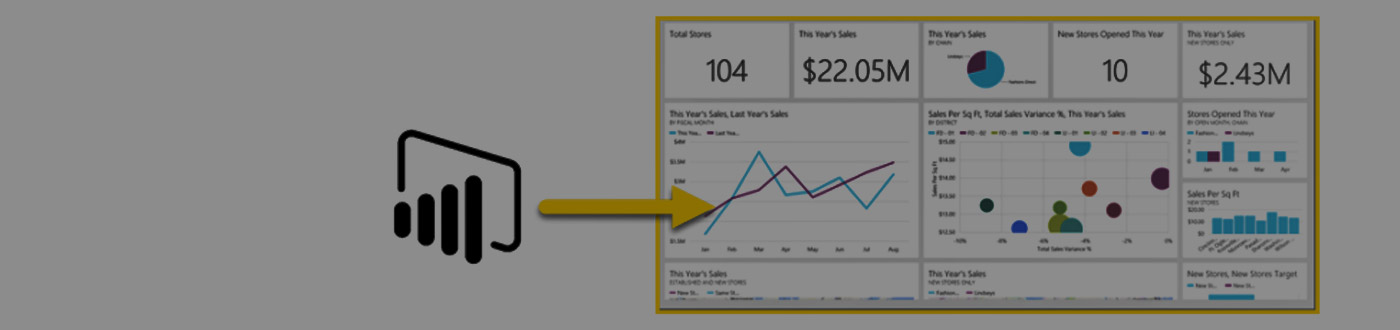
Note: The data shown above doesn't represent actual data and has been created for showcase purpose.

The Challenge

A fair is a gathering of people for a variety of entertainment or commercial activities. A survey was held to gather information about the people who attended the fair.

The event authorities wanted to learn what are the aspects that has been stopping people form visiting the fair or which aspects attracts people, but they weren't able to decipher the data easily.Hence, we converted the data into pretty and informational visuals, which shows the facts easily and clearly.

The idea is to study interests of people using which they learn about different aspects about organizing the fair next time.


The Solution

The task of giving the data a visual graphic was allocated to us. We thought about the information that can be useful to the event management authorities. We thought about the following:

  • Demographic profile of people who attended the fair, i.e which age range were attending most or which gender were interested most, from which income group most people visited, cultural background etc.
  • The survey included various questions about their enjoyment and their visits to such fairs, which was pictured into graphs so that they can get the information easily.
  • Ratings about various aspects of fair, i.e rides, food, shopping, paid tickets, etc. and ratings of the stalls that belonged to these aspects.
  • Percentage of people who knew the sponsors participated in the event such as media sponsors, automobile sponsors, radio partners, financial partners, etc.
  • Information about how they came to know about the fair and about their frequencies of attending the fair.
  • With whom most people like to accompany for State Fair visit and for how many years they had been attending this fair?

Would you like to digitize your business and put it on the cloud?
Do you need clear, concise reports for your organization?