Microsoft Power BI Consulting
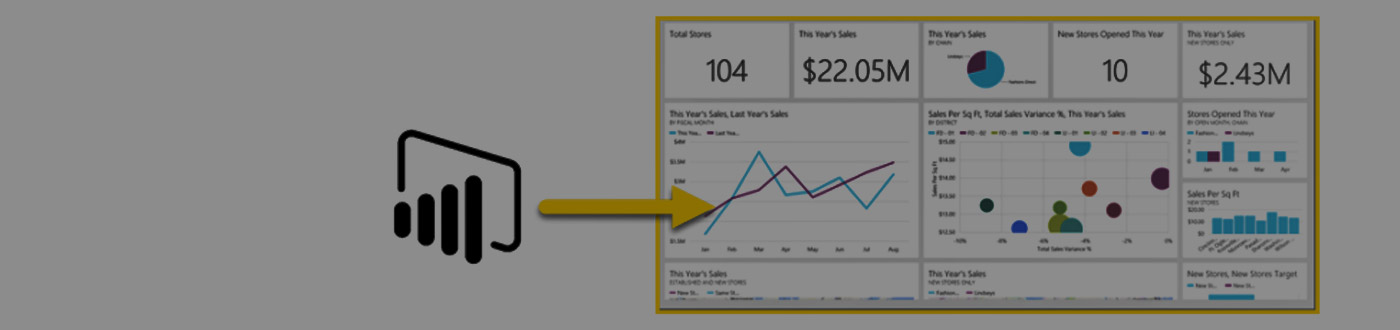
Sales Analysis
Note: The data shown above doesn't represent actual data and has been created for showcase purpose.
The Challenge
A sales analysis report shows the trends that occur in a company's sales volume over time. In its most basic form, a sales analysis report shows whether sales are increasing or declining. At any time during the fiscal year, sales managers may analyze the trends in the report to determine the best course of action. Managers often use sales analysis reports to identify market opportunities and areas where they could increase volume.
The Solution
- Information about profits and sales by Product and Customers
- Sales of Products and Countries by their Sales
- Sales and Profit by Country
- Sales and Profit by different entities such as Segment and Products
- Sales by New Customers & Old Customers
- Sales by Category & Subcategory of the products.
The Extra Mile
- User can drill through to Details of a particular country.
- User can identify which of their Customers & Products yield 80% of their sales.
- User can identify Churn Rate & Customer Lifetime Value and analyse their customers.
- Users can also analyse their Sales on the basis of Sales Growth & Profit Growth.
- We have provided maps for sales and profit so that they can differentiate that which country has least/most sales or profit.