Alternative way of Navigation for Power BI’s Table Visuals Using Pagination
Introduction
In many Power BI reports, table visuals are often designed with scroll bars, even when the amount of data being displayed is relatively small. To fit tables within limited report space, scrolling becomes the default interaction, requiring users to move up and down just to view the complete set of records.
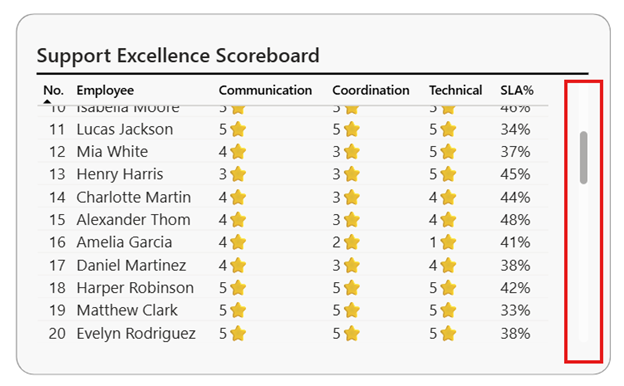
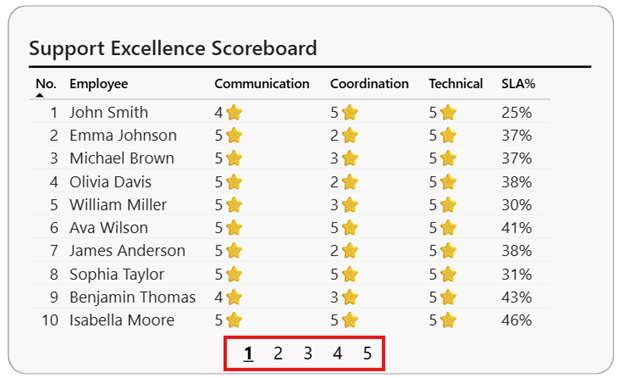
Table pagination provides a simple and effective alternative in such cases. By displaying data across neatly structured pages, pagination allows tables to occupy minimal space without relying on scroll bars, improving readability, and creating a more focused and user-friendly experience in Power BI.
Below are the steps to implement table pagination in a Power BI table visual.
Step 1: Create a Page Table for Pagination
- Create a calculated table to manage pagination logic.
- Calculate the total number of rows using a distinct count of the key identifier (e.g., Employee ID).
- Define a page size to control how many rows appear on each page.
- Compute the total number of pages based on total rows and page size.
- Use a generated series to create one row per page.
- Add Min and Max row boundaries for each page to determine which records belong to that page.
This page table acts as the foundation for controlling which rows are displayed per page in the table visual.
DAX For calculated table
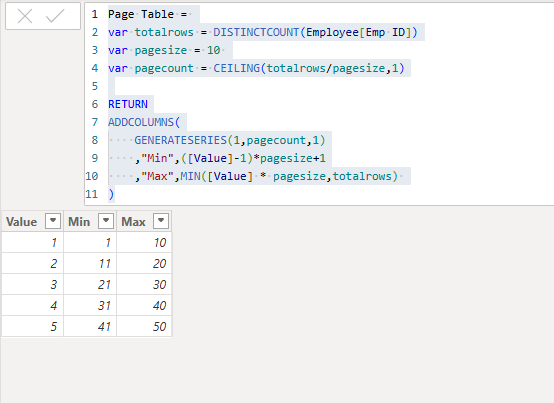
Page Table =
var totalrows = DISTINCTCOUNT(Employee[Emp ID])
var pagesize = 10
var pagecount = CEILING(totalrows/pagesize,1)
RETURN
ADDCOLUMNS(
GENERATESERIES(1,pagecount,1)
,”Min”,([Value]-1)*pagesize+1
,”Max”,MIN([Value] * pagesize,totalrows)
)
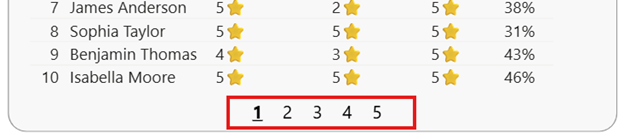
- Use value column as a button slicer
Step 2: Ensure a Sequential Column in the Table Visual
- Create a table visual with the required columns.
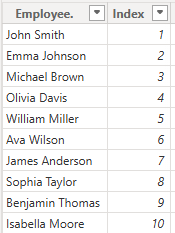
- The table must include a column with sequential numbering (1, 2, 3, …).
- This column acts as the row identifier for pagination logic.
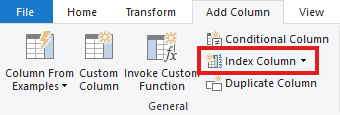
- If your dataset does not already have such a column, create an index column to generate it.
- Pagination will not work correctly without this sequential column in the table visual.
This ensures rows can be accurately filtered between the Min and Max values of each page.
- Use Power Query Index Column future to create Index Column
Step 3: Create a Filter Measure to Control Visible Rows
- Create a DAX measure to dynamically filter rows based on the selected page.
- Retrieve the Min and Max values from the Page Table for the current page selection.
- Compare these values with the row’s index column.
- Return 1 for rows that fall within the page range and 0 for those outside it.
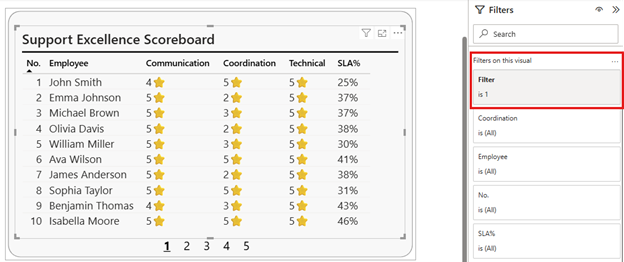
- Apply this measure as a visual-level filter on the table visual and keep only values equal to 1.
This measure ensures that only the rows belonging to the selected page are displayed in the table.
Filter =
var min_value = SELECTEDVALUE(‘Page Table'[Min])
var max_value = SELECTEDVALUE(‘Page Table'[max])
var currentindex = SELECTEDVALUE(Employee[Index])
RETURN
if(currentindex >= min_value && currentindex<= max_value,1,0)
Limitations
- When the table interacts with other visuals through cross-filtering or slicers, the filtered records may not fall within the currently selected page. In such cases, users may need to navigate through multiple pages to locate the relevant data.
- This pagination approach is best suited for small to moderate datasets. With very large datasets, it may become less effective and harder to manage compared to native scrolling or other performance-optimized solutions.
These limitations should be considered while deciding whether table pagination is the right fit for a specific reporting scenario.
Conclusion
Table pagination is a practical solution for displaying tables in minimal space without relying on scroll bars. When used thoughtfully and aligned with the report’s UI needs, it enhances readability and creates a cleaner, more focused user experience in Power BI.