Power BI > How to identify referenced Measures and Columns in Model – I
Most of the time, while updating the existing model, it’s hard to identify which measures or columns are being used in report visualization and which are referring to other measures or columns. Many times, while developing a report, there are frequent changes in the requirements and we need to modify/update the data model accordingly, which leads to adding or removal of measures or columns. Let’s assume that we need to remove some measures or columns from the model and the model is used by different reports.
Let’s jump into the steps that we need to follow to identify the referenced measures or columns. To achieve the above requirements, we need DAX Studio to be installed on the machine.
If you haven’t downloaded the DAX Studio yet, please click here to download the latest version & then install it.
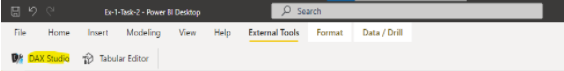
Now, let’s move to the Power BI report. Open Power BI Desktop and then open the Power BI file whose data model needs to be assessed. Then move to External Tools and open Dax Studio.
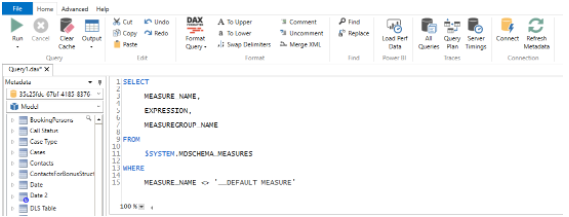
Once Dax Studio is opened, write the following code in Dax Studio to identify all the measures of the data model. You can refer to the above image to see how to write the code in Dax Studio. Execute the below query.
SELECT

     MEASURE_NAME,

     EXPRESSION,

     MEASUREGROUP_NAME

FROM

     $SYSTEM.MDSCHEMA_MEASURES

WHERE

     MEASURE_NAME <> '__DEFAULT MEASURE'
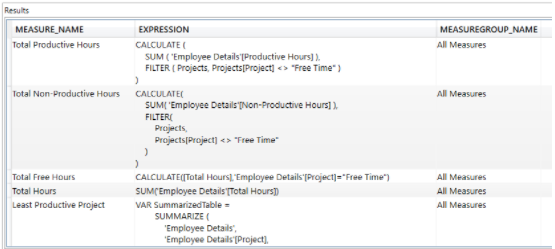
After running this query, you’ll get all the measures in the Results section with its Expression and MeasureGroupName.
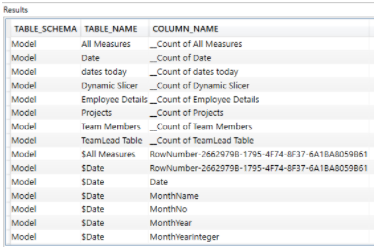
Now, to identify all the columns of the model, write the following code in Dax studio to identify all the columns of the data model.
SELECT

     TABLE_SCHEMA,

     TABLE_NAME,

     COLUMN_NAME

FROM

     $SYSTEM.DBSCHEMA_COLUMNS

WHERE

     TABLE_SCHEMA = 'MODEL'
Once you run the query, you’ll get the Table_Schema, Table_Name, and Column_Name.
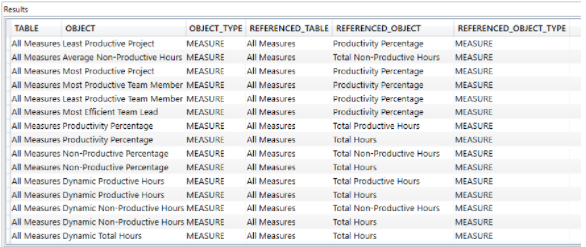
Now, we need to check the referenced Measures and Columns used in other measures. To get all the referenced measures, run the below code –
SELECT

     [TABLE],

     OBJECT,

     OBJECT_TYPE,

     REFERENCED_TABLE,

     REFERENCED_OBJECT,

     REFERENCED_OBJECT_TYPE

FROM

     $SYSTEM.DISCOVER_CALC_DEPENDENCY

WHERE

     OBJECT_TYPE = 'CALC_COLUMN'

     AND REFERENCED_OBJECT_TYPE = 'COLUMN'

     OR OBJECT_TYPE = 'MEASURE'

     AND REFERENCED_OBJECT_TYPE = 'MEASURE'

ORDER BY
     [TABLE] ASC
You can check the output in the Results section.
After getting all the results, you can easily compare the lists of measures and columns in Excel or in Power BI. Please note this blog will just help you to identify the referenced measure and columns.
To check which measures and columns are plotted in the visuals, please refer our next blog here: Referenced measures and columns in visuals