
Power BI has different DAX functions using which we can have our results in many different ways. As far as the result is concerned, it doesn’t matter which road we take to reach the destination but, we would always strive to get the most optimal solution.
We often need bi-directional relationships to let the filters flow in both directions. But we have heard numerous times that activating a bidirectional cross-filter in a data model might create ambiguous paths in the chain of relationships, resulting in very dangerous models as numbers become unpredictable.
So, we have been asked to use CROSSFILTER instead of activating the bidirectional cross filter.
This function specifies the cross-filtering direction to be used in a calculation for a relationship that exists between two columns. But, it introduces an ambiguity in the model where there are multiple paths between tables. It creates an intermediate table which is a cross join of the two tables with the relationship. Therefore, it takes a lot of time to load the measure as it creates a cross join table on the fly and then evaluates the expression.
We have found that using the USERELATIONSHIP instead of CROSSFILTER can give us the same results with better performance. At least, this worked well in our case but you need to validate this before making the changes to your data model.
There are some known limitations of USERELATIONSHIP() which could be found at this MSDN link.
Let’s take a scenario where we can see the performance of USERELATIONSHIP over CROSSFILTER.
We have two tables here:
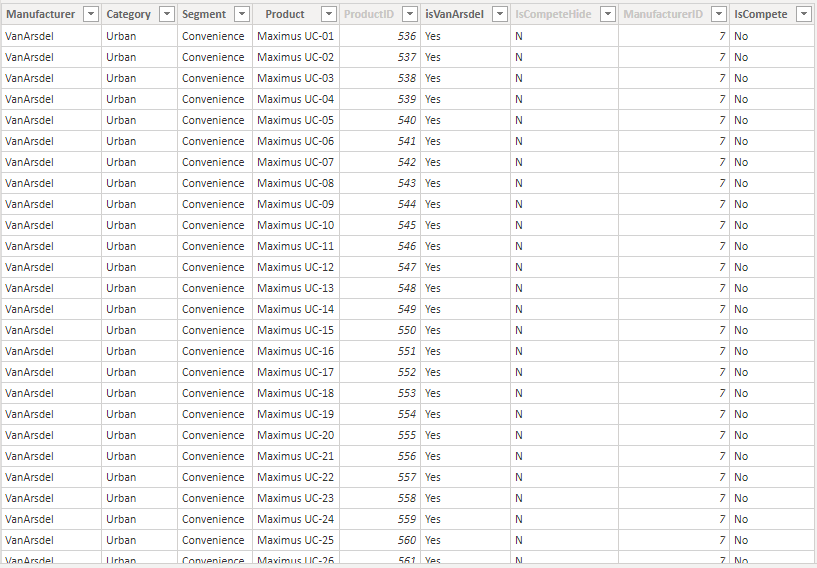
Product Table
Sales table
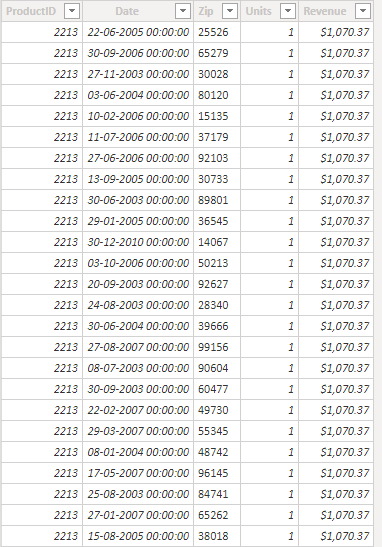
Although, the structure of the tables doesn’t matter using this approach.
The relationship between these two tables is as below:
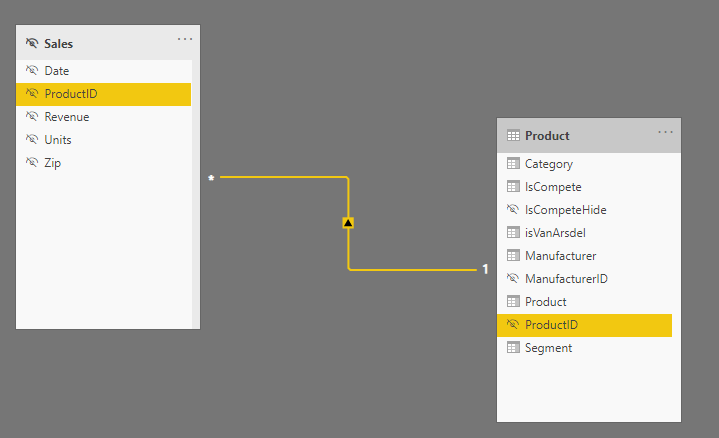
The above relationship works as: Product table filters Sales table.
But I also want to filter the Product table using the Zip field in the Sales table to see which location has done the best/worst sales. To achieve this, I would need to either change the direction of the relationship as “BOTH” or we can use the CROSSFILTER in the measure as stated in the below DAX:
Total Products CROSSFILTER =
CALCULATE (
   COUNT ( 'Product'[ProductID] ),
   CROSSFILTER ( 'Product'[ProductID], Sales[ProductID], BOTH )
)
But then we would need to use the CROSSFILTER function in every measure where we want this behavior.
The performance with the above approaches was not at par. Hence, instead of the mentioned approaches, we did as below. We created a duplicate column of the ProductID in the Sales table and created an inactive relationship between the two tables.
See the relationship below:
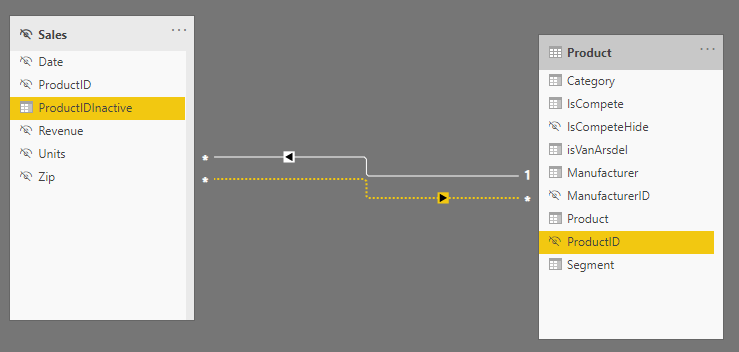 Here, the filter direction would be from Sales and Product.
Let’s see by creating the measures and see the performance of each of the measures:
Total Products USERELATIONSHIP =
CALCULATE (
   COUNT ( 'Product'[ProductID] ),
   USERELATIONSHIP ( 'Product'[ProductID], Sales[ProductIDInactive] )
)
After creating these two measures, I have plotted them in 2 different cards to see their performance using the Performance Analyzer.
Before recording the performance I have cleared the cache.
You can clear cache from File > Options and settings > Options > Data Load > Clear Cache
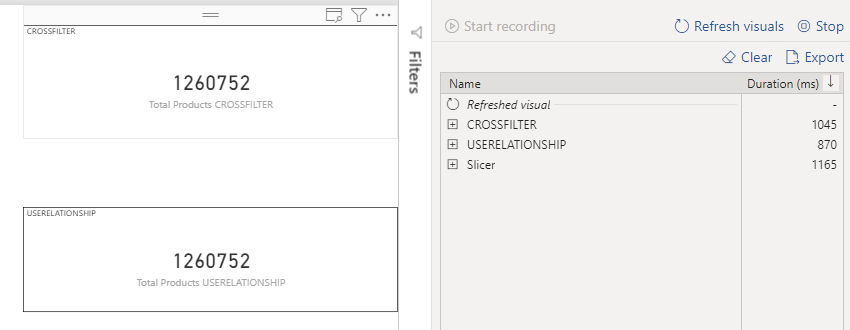 Here, we can see there has been a difference between the performance of the two measures.
With a lot of data in the file, it surely makes a major difference in the performance.
And it works exactly the same!
Hence, we can use USERELATIONSHIP instead of CROSSFILTER when there is huge data and complicated relationships.
Please let us know if you have any queries or suggestions in the comments.
Happy DAX-ting!
INKEY is your solution partner.
Our focus is to deliver you in-time intelligent innovative solutions ("key") for the problems in hand. Maintaining a quality standard right from the inception of a project is our top most priority.
Our team of talented professionals will execute your projects with dedication and excellence. We take ownership and accountability for the effort that goes into meeting our client’s needs.
Years of experience and proven success of delivering innovative custom solutions.


© All Rights Reserved. Inkey IT Solutions Pvt. Ltd. 2024


Leave a Reply