Dynamic Rating Sentences in Power BI
Introduction
In many Power BI reports, especially those capturing user feedback or survey responses, you may want to display a contextual sentence that reflects a given rating — something more human and insightful than just a number on a scale. But showing the same sentence, every time can feel repetitive. What if the report could pick a different sentence each time, drawn from a set of options for that rating?
This blog walks through how to build exactly that — a measure that randomly picks a sentence matching the current rating, using Power BI’s RAND() function. We’ll also cover when RAND() recalculates, so you know exactly when your sentences will refresh.
Step 1: Build the Rating–Sentence Table
Start by creating a table called ‘Prompt – Rating’ with two columns:
- Rating — a numeric value from 0 to 5
- Sentence — a descriptive sentence for that rating
Populate it with 3–4 sentences per rating level. For example:
| Rating | Sentence |
|---|---|
| 0 | -Performance is far below standards! |
| 0 | -Immediate improvement is required! |
| 0 | -Key responsibilities are not met! |
| 0 | -Strong corrective action needed! |
| 1 | -Performance is inconsistent! |
| 1 | -Expectations are rarely met! |
| 1 | -Frequent guidance is required! |
| 1 | -Improvement is critical! |
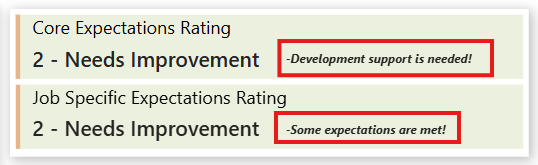
| 2 | -Some expectations are met! |
| 2 | -Gaps still exist in performance! |
| 2 | -Focused improvement is required! |
| 2 | -Development support is needed! |
| 3 | -Performance meets role requirements! |
| 3 | -Work quality is consistent! |
| 3 | -Goals are achieved as expected! |
| 3 | -Reliable contribution is observed! |
| 4 | -Performance exceeds expectations! |
| 4 | -Consistently delivers strong results! |
| 4 | -Adds value beyond the role! |
| 4 | -Shows high ownership! |
| 5 | -Performance is exceptional! |
| 5 | -Consistently sets benchmarks! |
| 5 | -Demonstrates leadership impact! |
| 5 | -Serves as a role model! |
This table acts as a sentence bank — the measure will dip into it and pull out one sentence at random for the active rating.
Step 2: The Random Rating Sentence Measure
Once the table is ready, create the following DAX measure:
Random Rating Sentence =
VAR FilteredTable =
FILTER (
‘Prompt – Rating’,
‘Prompt – Rating'[Rating] = [Expectations Rating]
)
VAR RandomRow =
TOPN ( 1, FilteredTable, RAND (), ASC )
RETURN
MAXX ( RandomRow, ‘Prompt – Rating'[Sentence] )
Let’s break down what each part does:
Understanding the Measure — Step by Step
VAR FilteredTable
This variable filter the Prompt – Rating table to only keep rows where the Rating column matches the current rating context — whatever rating value is active in the visual at that moment.
VAR RandomRow
This is where the magic happens. TOPN(1, FilteredTable, RAND(), ASC) picks the top 1 row from the filtered table — but instead of ordering by a fixed column, it orders by RAND(), which assigns a random decimal number between 0 and 1 to each row. Since the order is random, the “top” row is essentially a random pick from the pool.
RETURN MAXX(…)
Finally, MAXX extracts the Sentence value from that single randomly selected row and returns it as the measure’s output.
Why Use RAND() Instead of a Fixed Lookup?
A simple lookup — like filtering by rating and always returning the first match — would return the same sentence every time for a given rating. RAND() breaks that pattern by introducing unpredictability. It assigns a fresh random number to each row on every recalculation, so the “winner” (the row selected by TOPN) changes each time the measure is evaluated.
This gives your report a dynamic, varied feel without needing any additional data or complex logic — just one elegant DAX pattern.
When Will the Sentence Change?
RAND() is a volatile function in DAX, meaning it recalculates whenever the query engine re-evaluates the measure. Here is a breakdown of the scenarios:
Sentences WILL change when:
- Dataset Refresh — A full data refresh triggers a complete re-query of all visuals, causing RAND() to pick new values.
- Refreshing Visuals — This re-evaluates all measure queries in the current view.
- Opening or Reopening the Report (Power BI Service) — Each new session loads a fresh query, so a new sentence is selected.
Sentences will NOT change when:
- Cross-filtering and interaction between visuals on the same page do not trigger recalculation.
- Simply switching report pages and coming back — Power BI may cache the visual query depending on settings.
- Exporting to PDF or PowerPoint — the visual is captured as a snapshot at that point in time.
Conclusion
Using RAND() inside a TOPN sort is a clean, native DAX technique that adds personality and variation to your Power BI reports. By maintaining a simple two-column sentence bank per rating, you can surface a different, contextually appropriate message each time the report recalculates — keeping the experience fresh without any custom visuals or complex logic.
This approach is especially powerful for survey dashboards, NPS reports, performance scorecards, or any report where you want a qualitative context to accompany a numeric rating — making the data feel less cold and more actionable.