Logistics & Transport
Analytics Dashboard for a Shipping Corporation
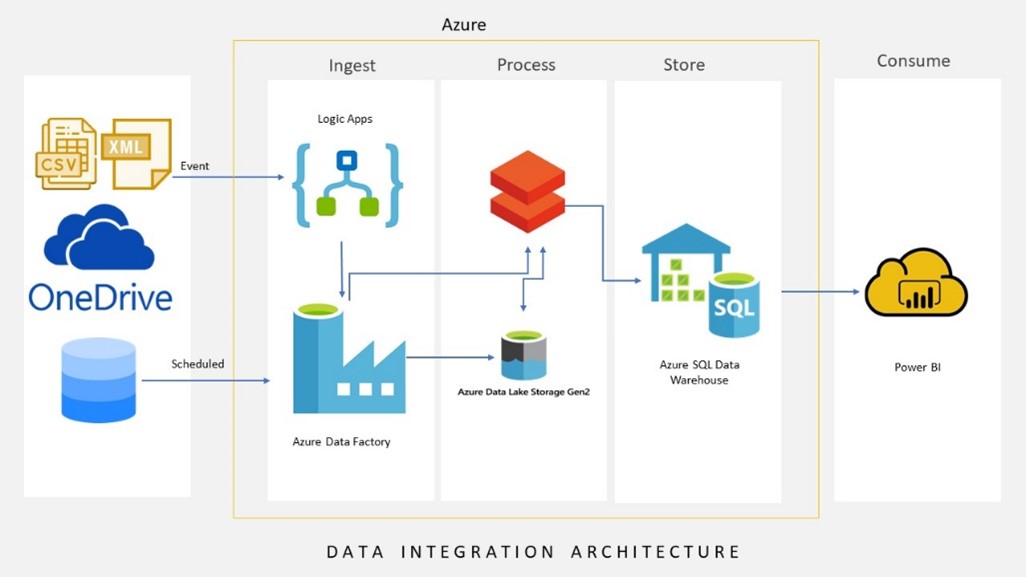
The client was looking to build a near real-time Operations Dashboard for the Operations as soon as the data arrived. Their data was both in structured and semi-structured formats. The semi-structured data was delivered throughout the day in XML or CSV formats. The structured data was sourced from an on-prem SQL Server. The client wanted an Operations Analytics Dashboard built from the above data sets that could show how efficient the operational process is while loading and unloading train cars that load materials in the vessels, how efficient is the handover process from one shift to another, the number of safety incidents, and maintenance over the period, such as daily, weekly, and monthly.
The Challenge
What Was Holding the Business Back?
The organization lacked a unified view of operational performance, making it difficult to monitor efficiency, safety, maintenance, and shift handovers in near real time.
Data Complexity
Operational data arrived from multiple sources in both structured and semi-structured formats throughout the day.
Delayed Visibility
Business users required faster access to operational metrics to support timely decisions and issue resolution.
Operational Tracking
Monitoring loading, unloading, maintenance, and safety activities across periods was challenging and time-consuming.
Objective
What We Set Out to Achieve
Create a near real-time analytics platform that consolidates operational data from multiple sources and provides visibility into efficiency, safety, maintenance performance, and shift operations through interactive dashboards.
Our Approach & Solution
How We Delivered Results
An automated data platform was implemented to ingest, process, and analyze operational data, providing near real-time visibility into key business metrics.
01
Data Collection
Automated ingestion of XML, CSV, and SQL Server data using event-driven processes and scheduled data capture mechanisms.
02
Data Processing
Integrated and transformed operational data into a centralized analytical repository for consistent reporting and analysis.
03
Operations Insights
Delivered dashboards covering safety incidents, loading efficiency, maintenance performance, and operational handovers.
Fast Refresh
Completed data processing every 15 minutes, exceeding the original 30-minute refresh requirement.
User Analysis
Enabled drill-through analysis, period comparisons, and interactive KPI exploration across operational metrics.
Results & Impact
The Outcome
The solution improved operational visibility and enabled faster monitoring of critical business activities.
Timely
Data Availability
Safer
Safety Monitoring
Faster
Issue Response
Higher
Operational Efficiency
Conclusion
The Bigger Picture
The near real-time analytics solution provided the shipping organization with a centralized view of operational performance across safety, maintenance, loading activities, and shift handovers. By consolidating data from multiple sources and delivering timely insights, the organization gained better visibility into critical processes and improved operational decision-making. The solution exceeded performance expectations by reducing data refresh times while providing users with interactive analysis capabilities to identify trends, monitor KPIs, and drive continuous operational improvements.
Additional Details
Ready to Transform Your Business with Data?
Connect with our team and let's build your intelligence story.