Have You Ever Thought of Turning a Power BI Table into a Custom Bar Chart?
 By Fenil Italiya
November 5, 2026
5 min read
Introduction
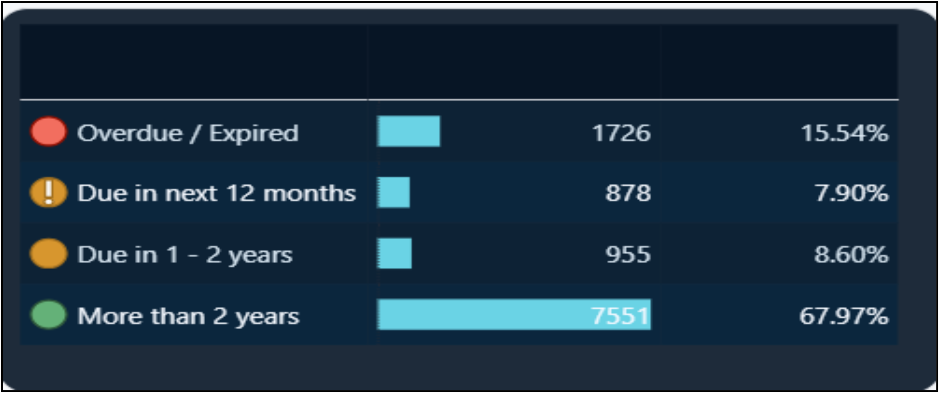
- A standard Power BI Table visual is useful for displaying detailed information but may lack the visual impact required for dashboard reporting. To address this, we transformed the native Table visual into a compact, engaging, bar chart-style visual to display risk categories, asset counts, and percentages using conditional formatting, data bars, icons, sorting, and visual formatting instead of external custom visuals. This approach provides a clean, dashboard-friendly appearance while retaining the flexibility and interactivity of a native Power BI visual.
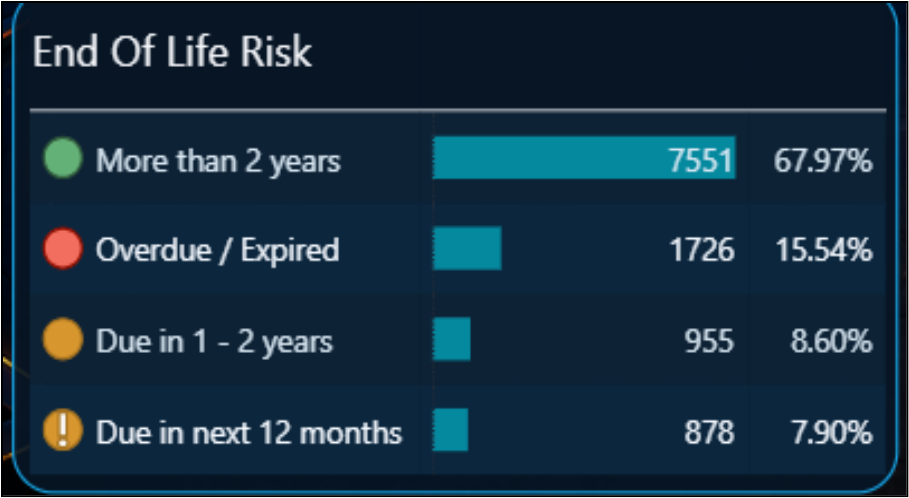
To build this visualization, we followed the steps below.
Step 1: Prepare the Required Fields
Create or identify the fields/measures required for the visual, such as:
- Risk Category – More than 2 years, Overdue/Expired, Due in 1–2 years, Due in next 12 months
- Asset Count – Number of assets in each category
- Percentage – Percentage of total assets
Add these fields to a Power BI Table visual.
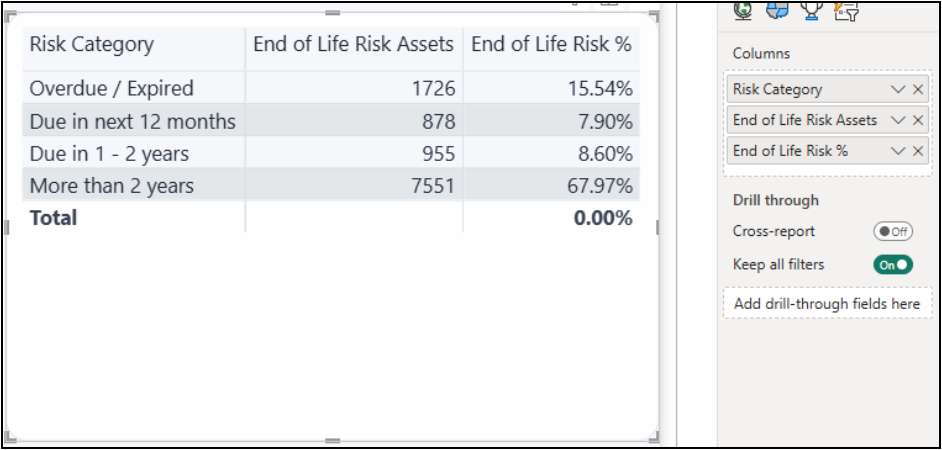
Step 2: Format Table Visual
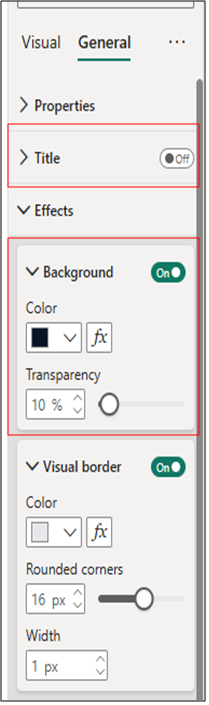
Once the required fields are added to the Table visual, format the visual to create a clean and dashboard-friendly appearance.
- Title: Turn Off the Title option.
- Background: Enable the Background option and select a color that complements your report theme. For a dark-themed dashboard, a dark navy/blue shade can provide a consistent and professional appearance.
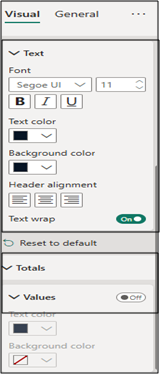
- Column Headers: Customize the Text Color and Background Color of the column headers. Set both colors to the same color as the visual background to hide the default column-header appearance and achieve a cleaner look.
- Totals : Turn off Totals.
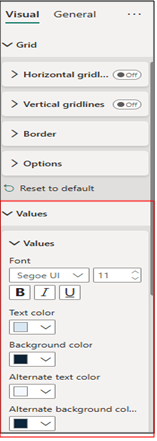
Step 3: Increase Row Padding and Turn off Gridlines to Create a Bar Chart–Like Appearance
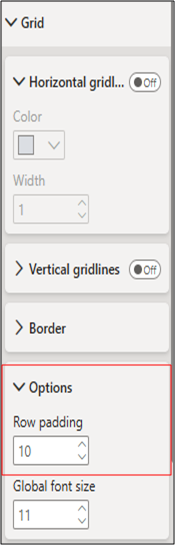
Adjust the Grid settings to give the table a cleaner, bar-chart-like appearance:
- Vertical gridlines: Turn Off to remove vertical separators between columns.
- Horizontal gridlines: Turn Off to eliminate the default row separators.
- Row Padding: Open the Options menu under the Grid section and increase the Row padding value to add more spacing between rows. This makes the data bars appear more prominent and gives the table a visual appearance similar to a bar chart.
Step 4: Apply Icons using Conditional Formatting on the First Column
To make the risk categories easier to identify visually, apply Icons to the first column using Power BI’s conditional formatting.
- Select the Table visual and open the dropdown for the first column, such as Risk Category.
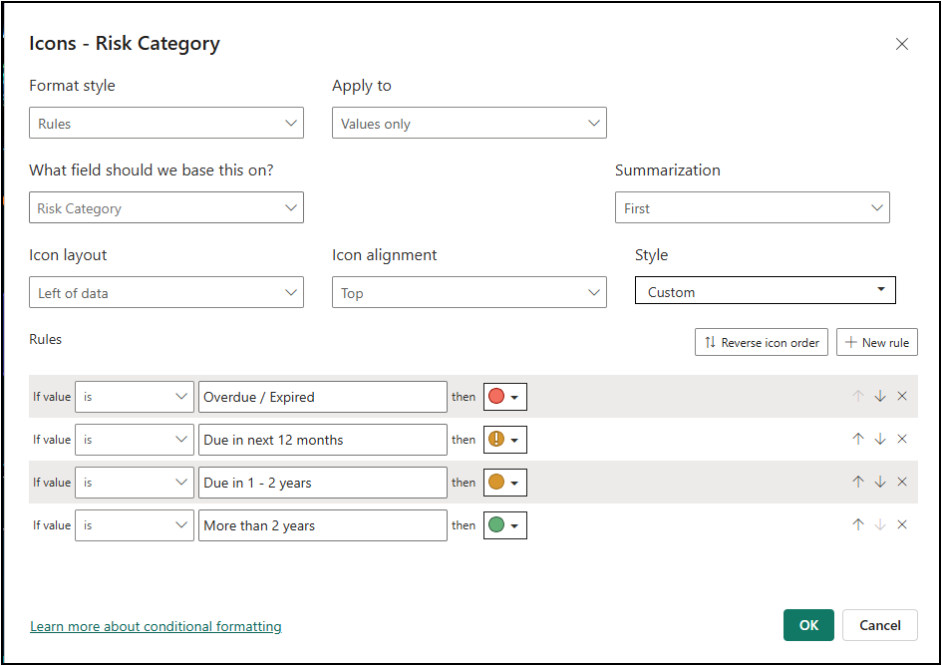
- Select Conditional formatting → Icons and enable the Icons option.
- Set the Format style to Rules and define rules for each category. For example, assign different icons based on the corresponding risk level.
- Configure the icon position as Left so that the indicator appears before the category name, creating a clear visual hierarchy.
- Adjust the icon style and size according to your report theme so that each risk category can be identified quickly without affecting the readability of the text.
Step 5: Apply Conditional Formatting on Values you want as Bars
To make the numerical values more visually meaningful, apply Data Bars to the columns where you want to represent the magnitude of the values.
- Select the Table visual and open the dropdown for the required value column, such as End of Life Risk Assets.
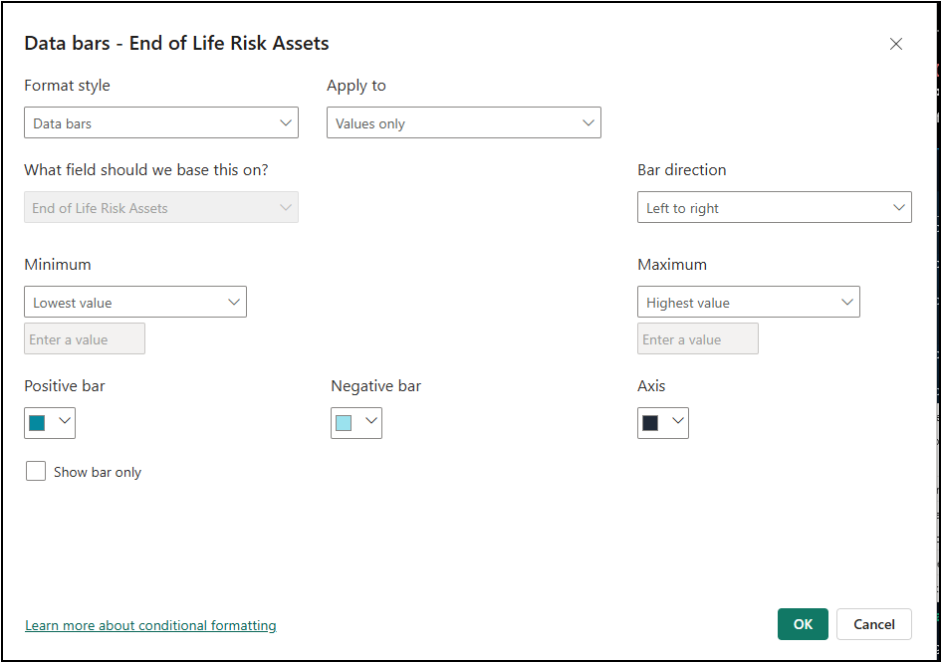
- Select Conditional formatting → Data bars and turn on the Data bars option.
- Configure the bar color, minimum value, and maximum value according to your report theme. You can also enable Show bar only if you want to display the bar instead of the numerical value.
This creates an easy-to-read visual comparison where the length of each bar represents the relative value, making higher and lower values immediately distinguishable.
Step 6: Add a Title Using a Shape
To create a clean title for the visual, use a shape with text instead of the built-in visual title.
- Go to Insert → Shapes and select a suitable shape, such as a Rectangle.
- Resize and position the shape above the table visual according to your layout.
- Turn the Border/Outline Off so the shape blends seamlessly with the report background.
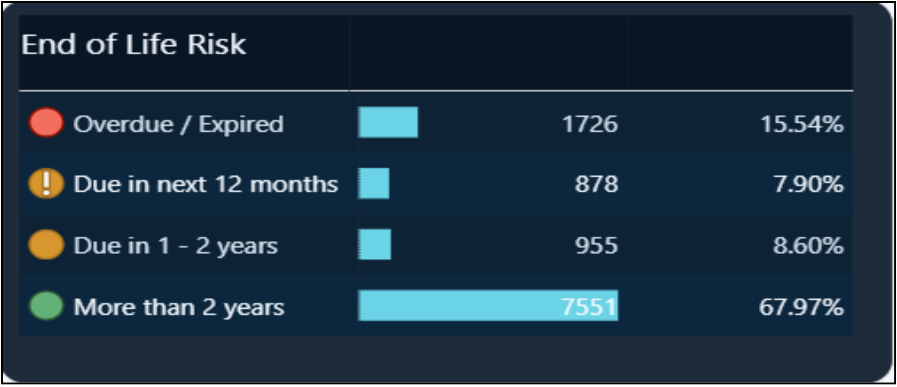
- Enable Text within the shape and enter the desired title, such as “End of Life Risk”.
- Customize the font size, weight, alignment, and text color to match the overall report theme.
Conclusion
By combining the native Power BI Table visual with features such as conditional formatting, data bars, icons, custom sorting, and strategic formatting, standard tables can be transformed into clean, interactive, and dashboard-friendly visuals without relying on custom visuals. These techniques improve readability by making important patterns, comparisons, and trends easier to identify at a glance.
Users can also sort the visual by any available column simply by clicking the column header, providing flexibility to explore the data from different perspectives. Since the approach relies primarily on built-in Power BI capabilities rather than additional formatting-specific DAX measures, it remains lightweight, maintainable, scalable, and easy to replicate across different reports and business scenarios.