Managing SCD with Fabric DataflowGen2
Slowly Changing Dimensions (SCD) are essential for tracking historical data in analytics workflows. Microsoft Fabric DataflowGen2 enables efficient implementation of SCD Type 2, where changes to dimensional attributes are captured as new records, preserving historical data.
What Are Slowly Changing Dimensions (SCD)?
SCD Type 2 is a data warehousing technique for handling changes in dimension data. When an attribute of a dimension record changes:
- The existing record is marked as inactive (with an end date).
- A new record is created for the updated dimension, preserving the historical state.
This approach ensures that the full history of changes is available for analysis.
Leveraging Fabric DataflowGen2 for SCD Type 2
Fabric DataflowGen2 provides powerful tools to implement SCD Type 2. Here’s how it handles student admission data with this methodology:
Step-by-Step Workflow
Step 1. Data Sources and Preparation
Source :
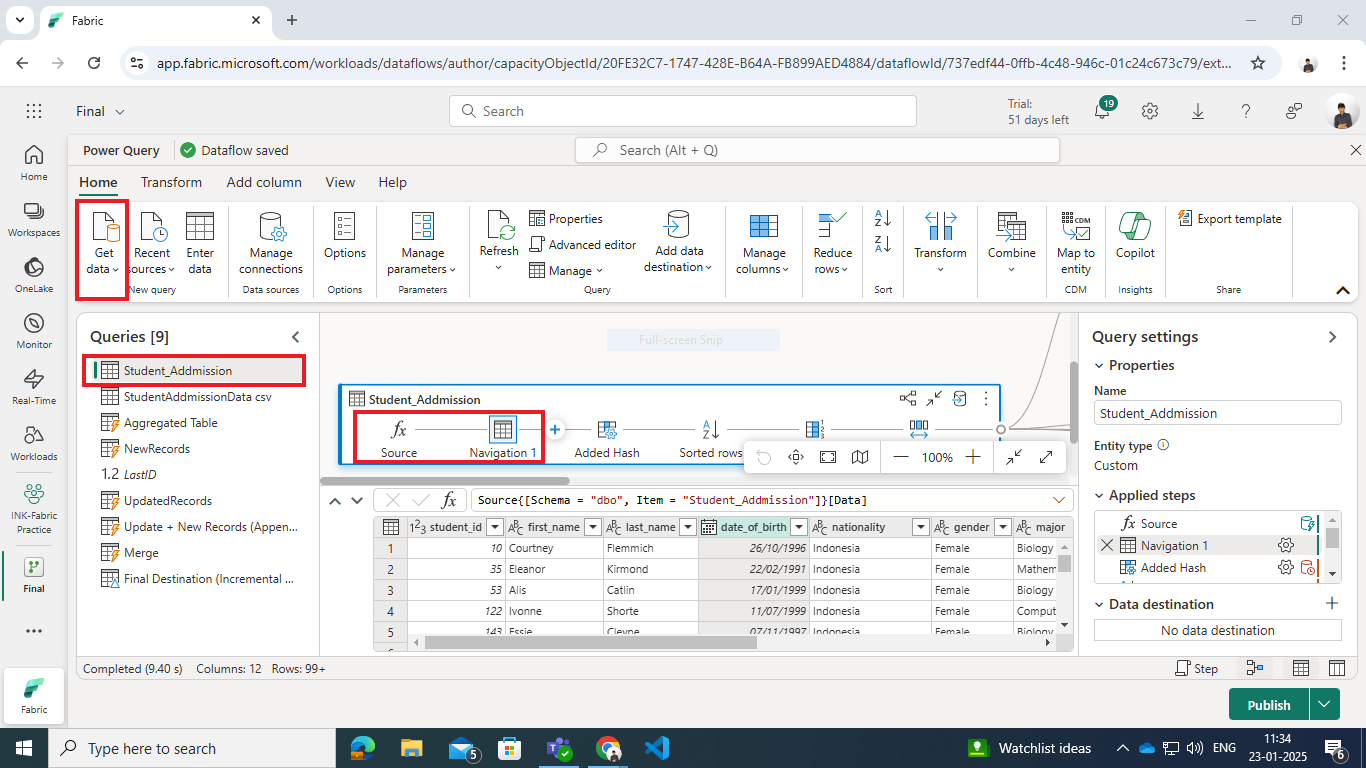
- Warehouse/Dimension Table (Student_Addmission): Contains historical student data.
- Dataset Overview
- The Dimension Table contains:
- Columns: student_id, first_name, last_name, date_of_birth, nationality, gender, major, admission_date, tuition_fee, StartDate, EndDate, IsCurrent.
- The Dimension Table contains:
Power Query code:
let
Source = Fabric.Warehouse(null){[workspaceId = “f84dd802-2dfa-453c-8349-b5808e026dc1”]}[Data]{[warehouseId = “50e20c14-7cd2-42bf-a4e6-c866c035d7ba”]}[Data],
#”Navigation 1″ = Source{[Schema = “dbo”, Item = “Student_Addmission”]}[Data],
#”Added Hash” = Table.TransformColumnTypes(Table.AddColumn(#”Navigation 1″, “Hash”, each Binary.ToText( Text.ToBinary( Text.Combine(List.Transform({[student_id],[first_name],[last_name],[date_of_birth],[nationality],[gender],[major],[admission_date],[tuition_fee]}, each if _ = null then “” else Text.From(_)), “|”)), BinaryEncoding.Hex)), {{“Hash”, type text}}),
#”Sorted rows” = Table.Sort(#”Added Hash”, {{“student_id”, Order.Ascending}}),
#”Added index” = Table.AddIndexColumn(#”Sorted rows”, “Index”, 1, 1, Int64.Type),
#”Reordered columns” = Table.ReorderColumns(#”Added index”, {“Index”, “student_id”, “first_name”, “last_name”, “date_of_birth”, “nationality”, “gender”, “major”, “admission_date”, “tuition_fee”, “StartDate”, “EndDate”, “IsCurrent”, “Hash”})
in
#”Reordered columns”
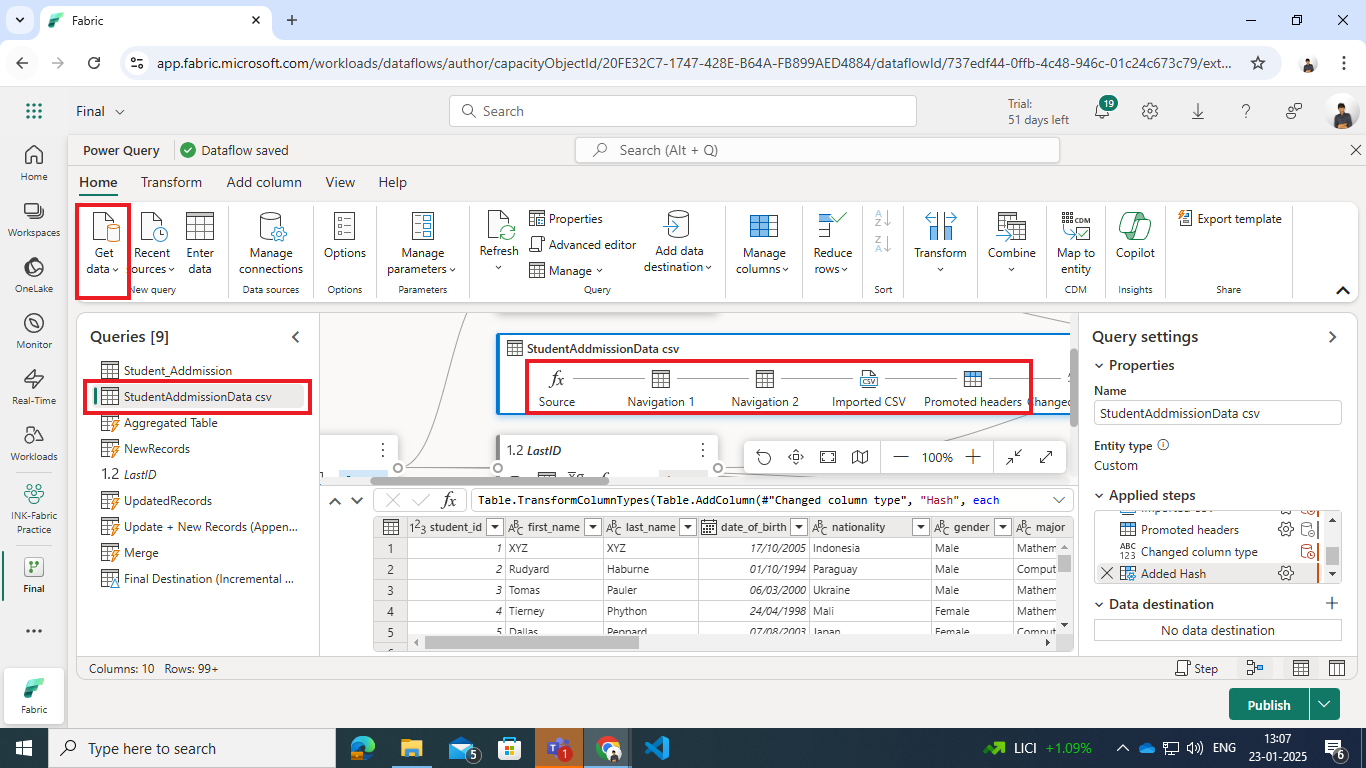
- Source Data / CSV File (StudentAddmissionData.csv): Holds new and updated records.
- Dataset Overview
- The source CSV file contains:
- Columns: student_id, first_name, last_name, date_of_birth, nationality, gender, major, admission_date, tuition_fee.
- Purpose: Track student admissions with historical accuracy.
- The source CSV file contains:
- Dataset Overview
Power Query code:
let
Source = Lakehouse.Contents(null){[workspaceId = “f84dd802-2dfa-453c-8349-b5808e026dc1”]}[Data]{[lakehouseId = “2c4d293f-5d66-459d-8119-dea9d6986c8a”]}[Data],
#”Navigation 1″ = Source{[Id = “Files”, ItemKind = “Folder”]}[Data],
#”Navigation 2″ = #”Navigation 1″{[Name = “StudentAddmissionData.csv”]}[Content],
#”Imported CSV” = Csv.Document(#”Navigation 2″, [Delimiter = “,”, Columns = 9, QuoteStyle = QuoteStyle.None]),
#”Promoted headers” = Table.PromoteHeaders(#”Imported CSV”, [PromoteAllScalars = true]),
#”Changed column type” = Table.TransformColumnTypes(#”Promoted headers”, {{“student_id”, Int64.Type}, {“first_name”, type text}, {“last_name”, type text}, {“date_of_birth”, type date}, {“nationality”, type text}, {“gender”, type text}, {“major”, type text}, {“admission_date”, type date}, {“tuition_fee”, type number}}),
#”Added Hash” = Table.TransformColumnTypes(Table.AddColumn(#”Changed column type”, “Hash”, each Binary.ToText( Text.ToBinary( Text.Combine(List.Transform({[student_id],[first_name],[last_name],[date_of_birth],[nationality],[gender],[major],[admission_date],[tuition_fee]}, each if _ = null then “” else Text.From(_)), “|”)), BinaryEncoding.Hex)), {{“Hash”, type text}})
in
#”Added Hash”
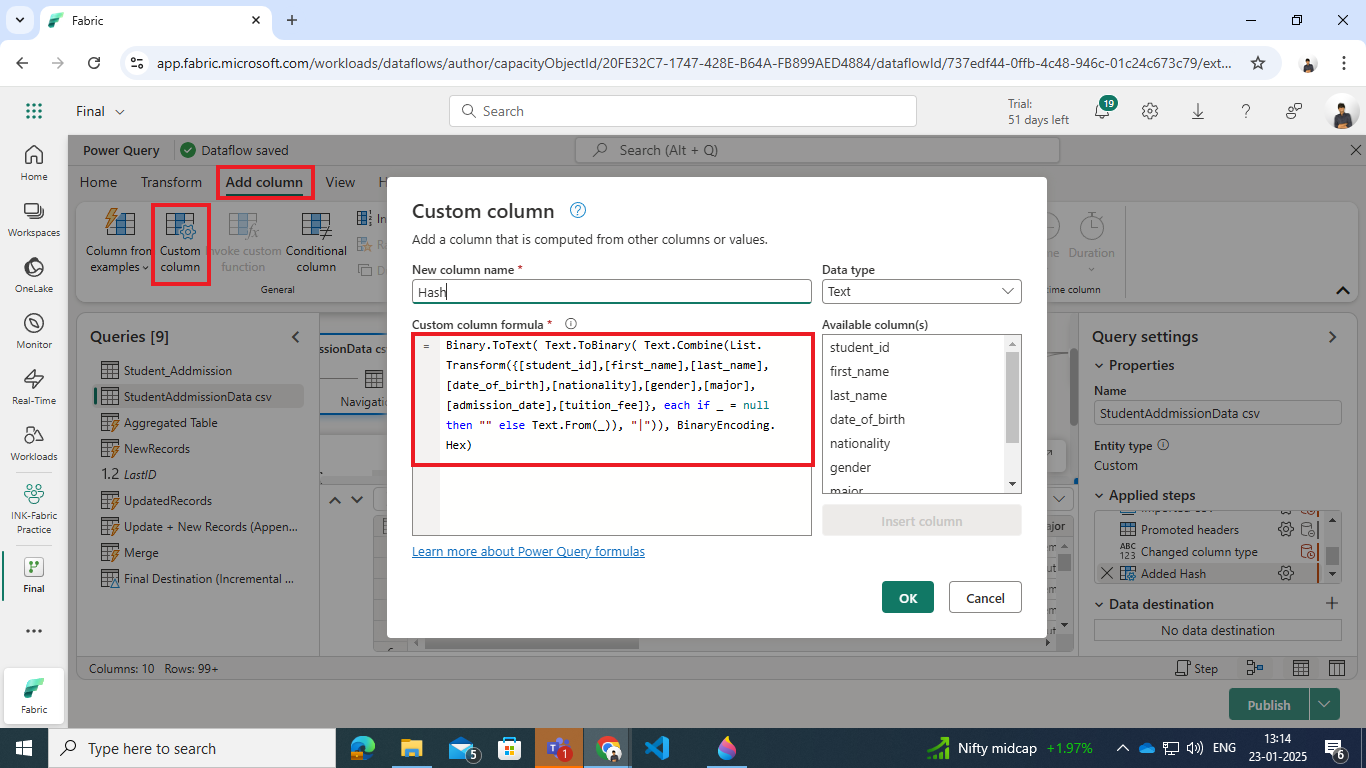
Step 2: Compute a Hash for Change Detection
A Hash column is added to both the existing dimension table in the warehouse and the source data. This column acts as a checksum, combining all relevant attributes (e.g., first_name, last_name, etc.) to detect changes.
- Add column > Custom column
Formula:
Binary.ToText( Text.ToBinary( Text.Combine(List.Transform({[student_id],[first_name],[last_name],[date_of_birth],[nationality],[gender],[major],[admission_date],[tuition_fee]}, each if _ = null then “” else Text.From(_)), “|”)), BinaryEncoding.Hex)
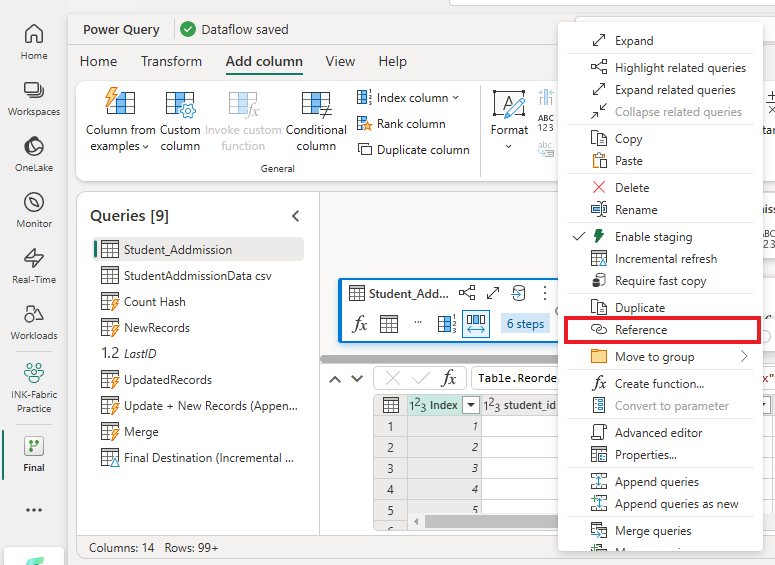
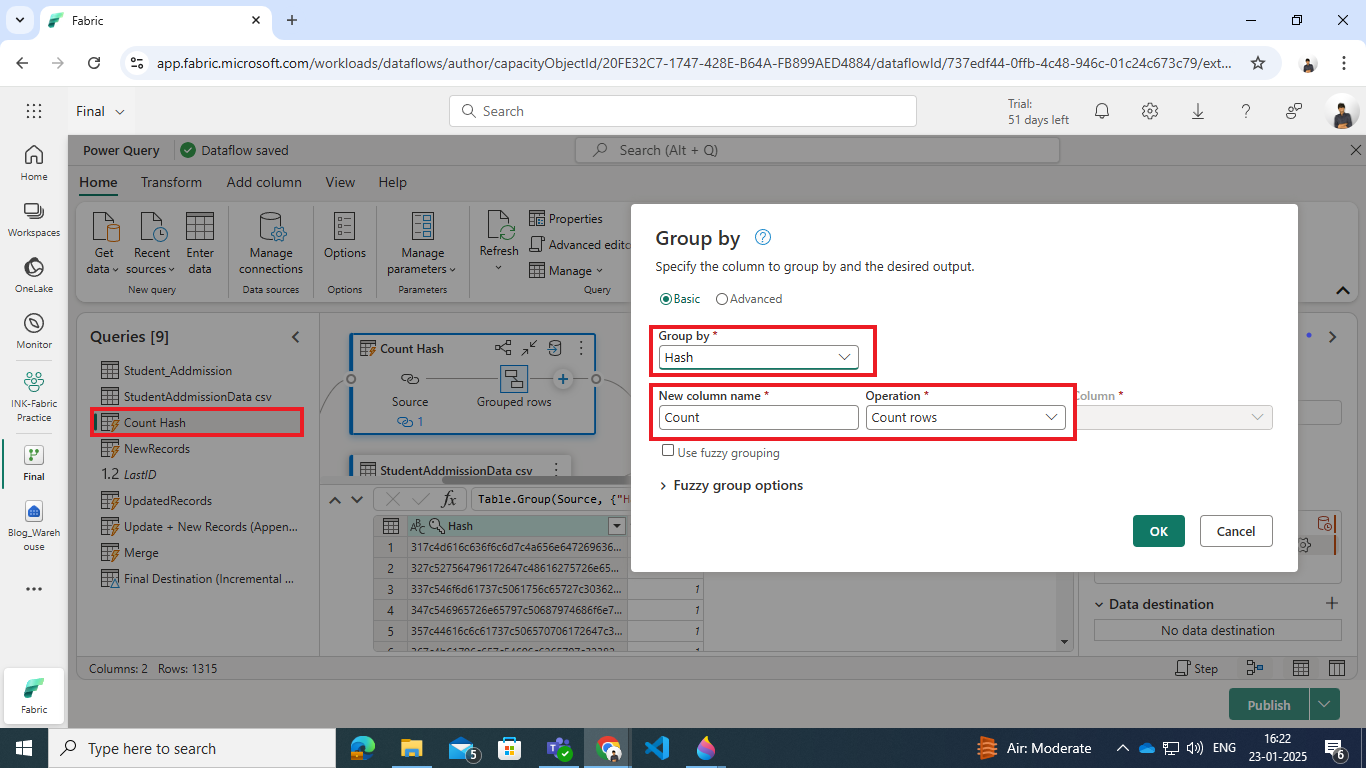
Step 3: Group and Count Hashes
To ensure efficient comparison and identify the uniqueness of records, the Student_Addmission (dimension table) query was referenced, and a grouping operation was performed based on the Hash column.
- Purpose of Grouping:
- Group records by their Hash value.
- Count the occurrences of each hash to identify unique and duplicate records.
- Output:
- The grouped table provides a summary of how many records share the same hash, enabling efficient identification of new or changed records when compared to the source dataset.
Power Query code:
let
Source = Student_Addmission,
#”Grouped rows” = Table.Group(Source, {“Hash”}, {{“Count”, each Table.RowCount(_), Int64.Type}})
in
#”Grouped rows”
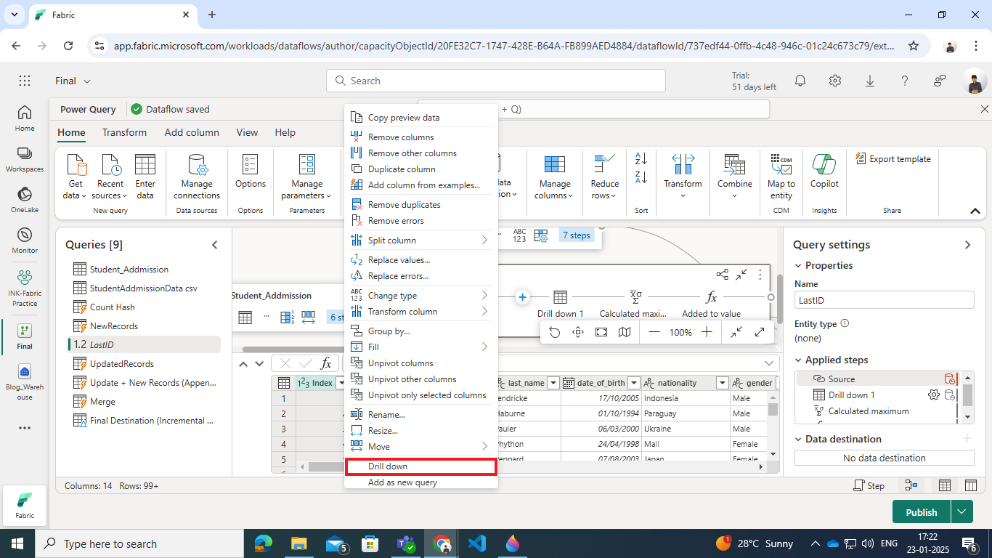
Step 4: Calculate Maximum Index for Incremental Updates
A query is created to calculate the maximum Index value from the dimension table and prepare for appending new records.
- Reference the Dimension Table:
- The query starts by referencing the Student_Addmission table.
- Drill Down to the Index Column:
- The Index column is isolated to create a list of all index values.
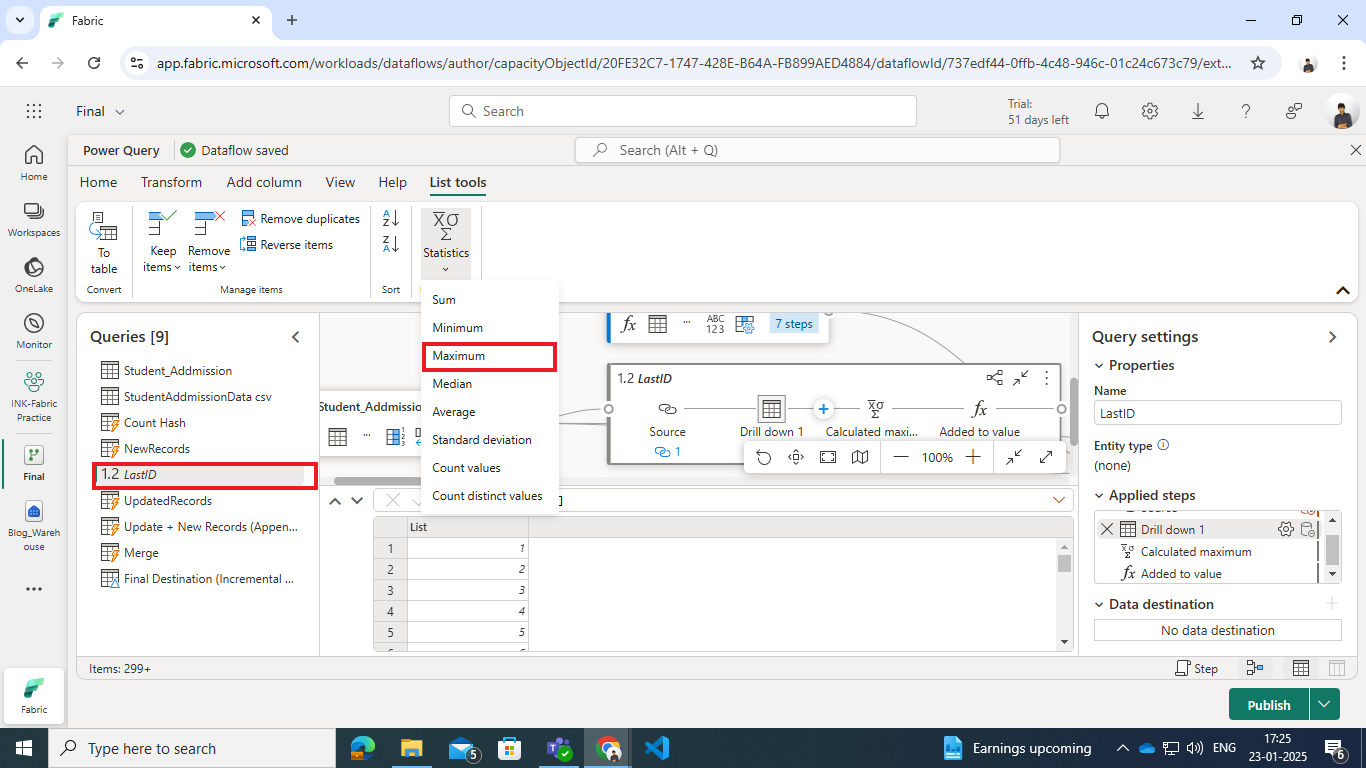
- Calculate the Maximum Index:
- The List.Max function computes the highest index value from the list.
- Also uncheck Enable Staging for the list.
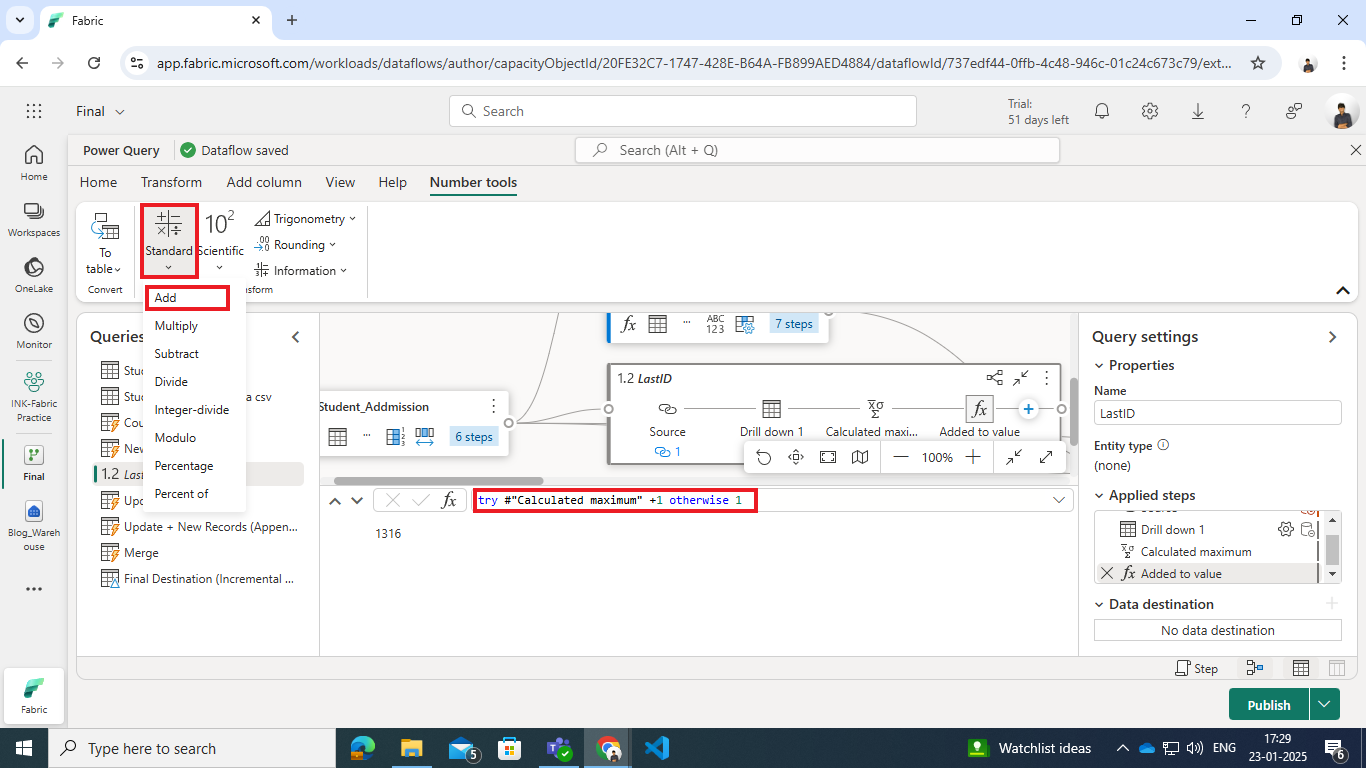
- Add +1 to the Maximum Value:
- The maximum value is incremented by 1 to determine the starting index for new records.
- If the dimension table is empty, the try statement ensures the starting index defaults to 1.
Power Query code:
let
Source = Student_Addmission,
#”Drill down 1″ = Source[Index],
#”Calculated maximum” = List.Max(#”Drill down 1″),
#”Added to value” = try #”Calculated maximum” +1 otherwise 1
in
#”Added to value”
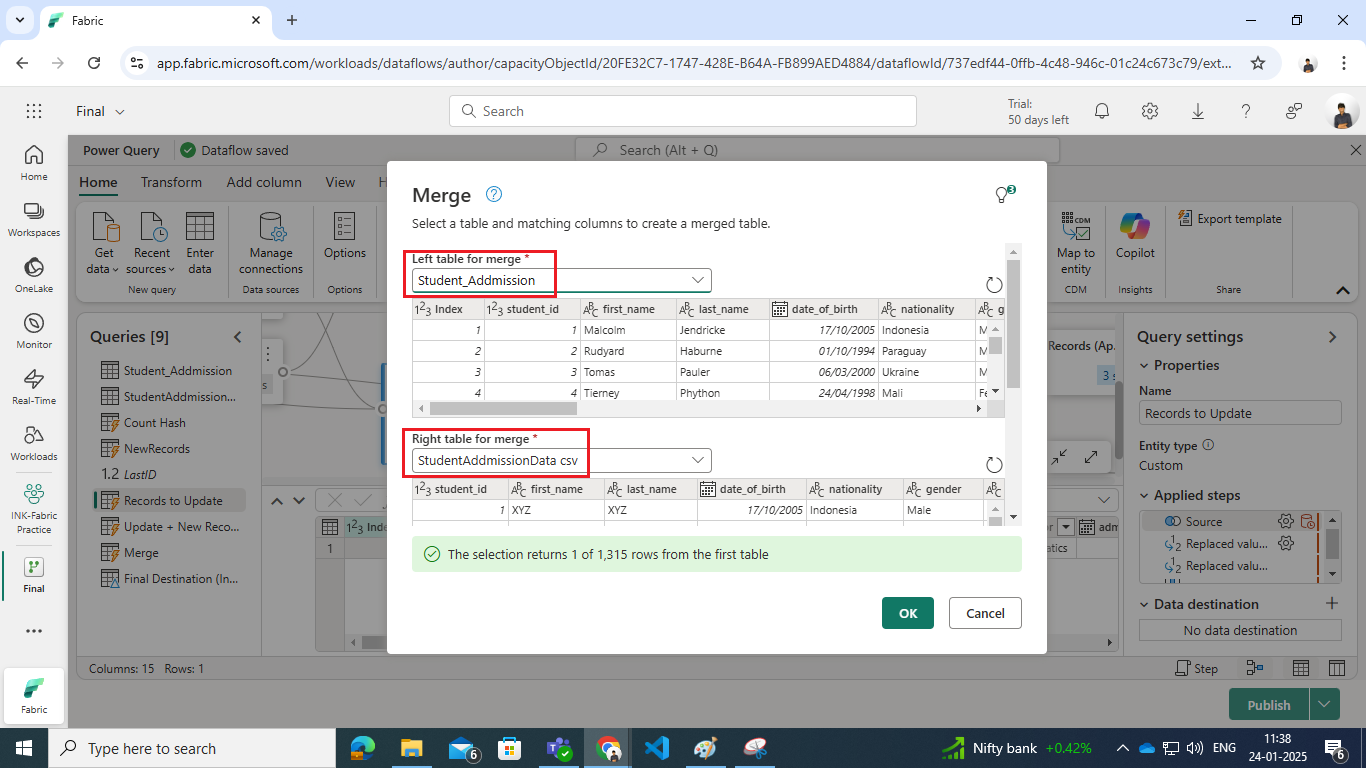
Step 5: Merge Queries and Identify New Records
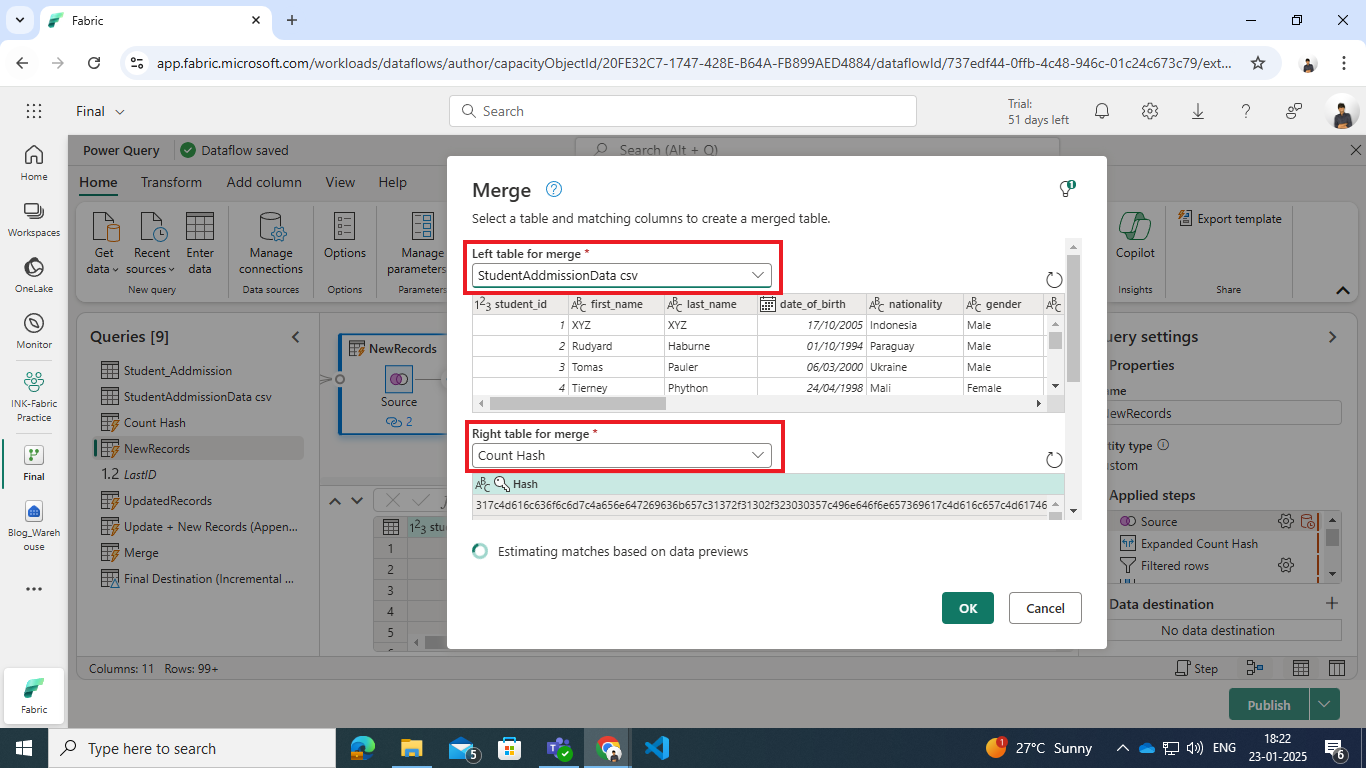
- Merge Source CSV with Count Hash :
- Select the source data (Student CSV) and use the Merge Queries as New option.
- Perform a Left Outer Join with the grouped Hash Count query.
- Left table for merge : source data (Student CSV)
- Right table for merge : Hash Count query
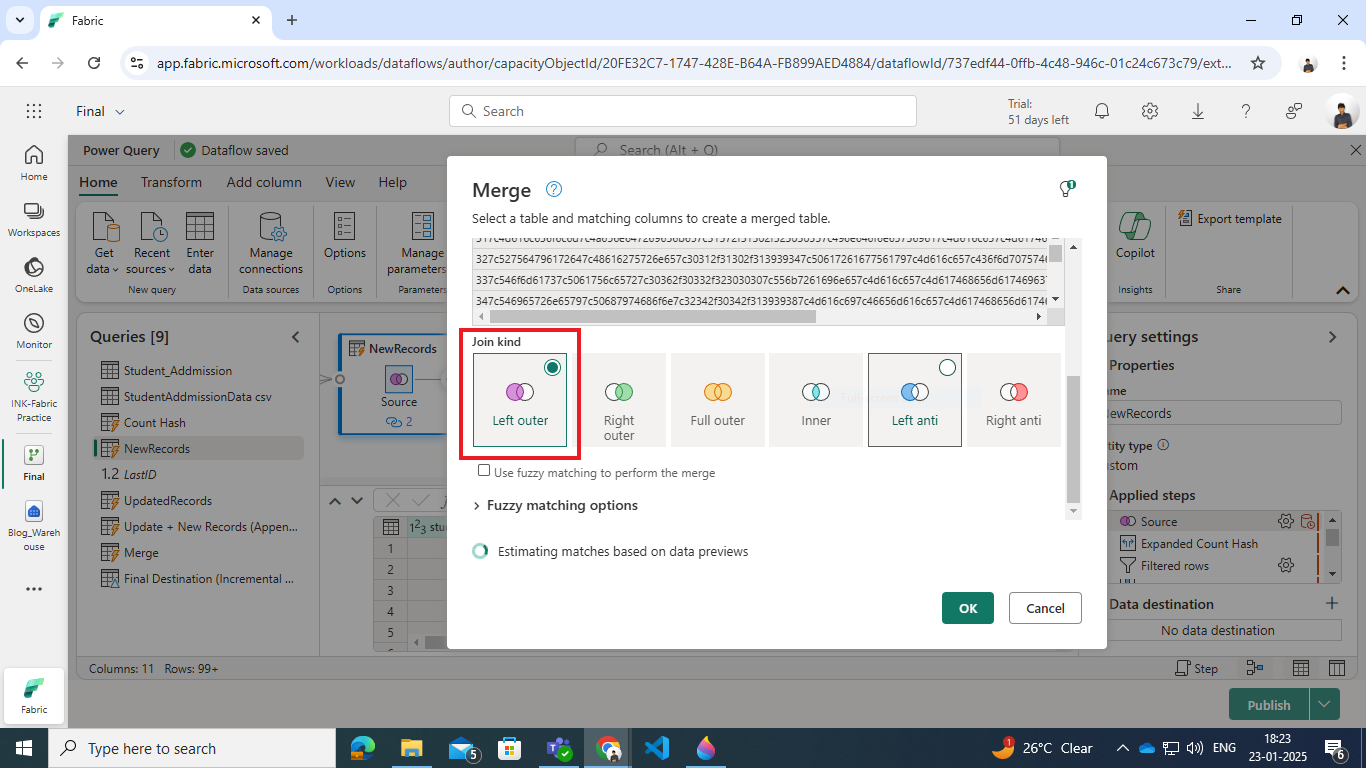
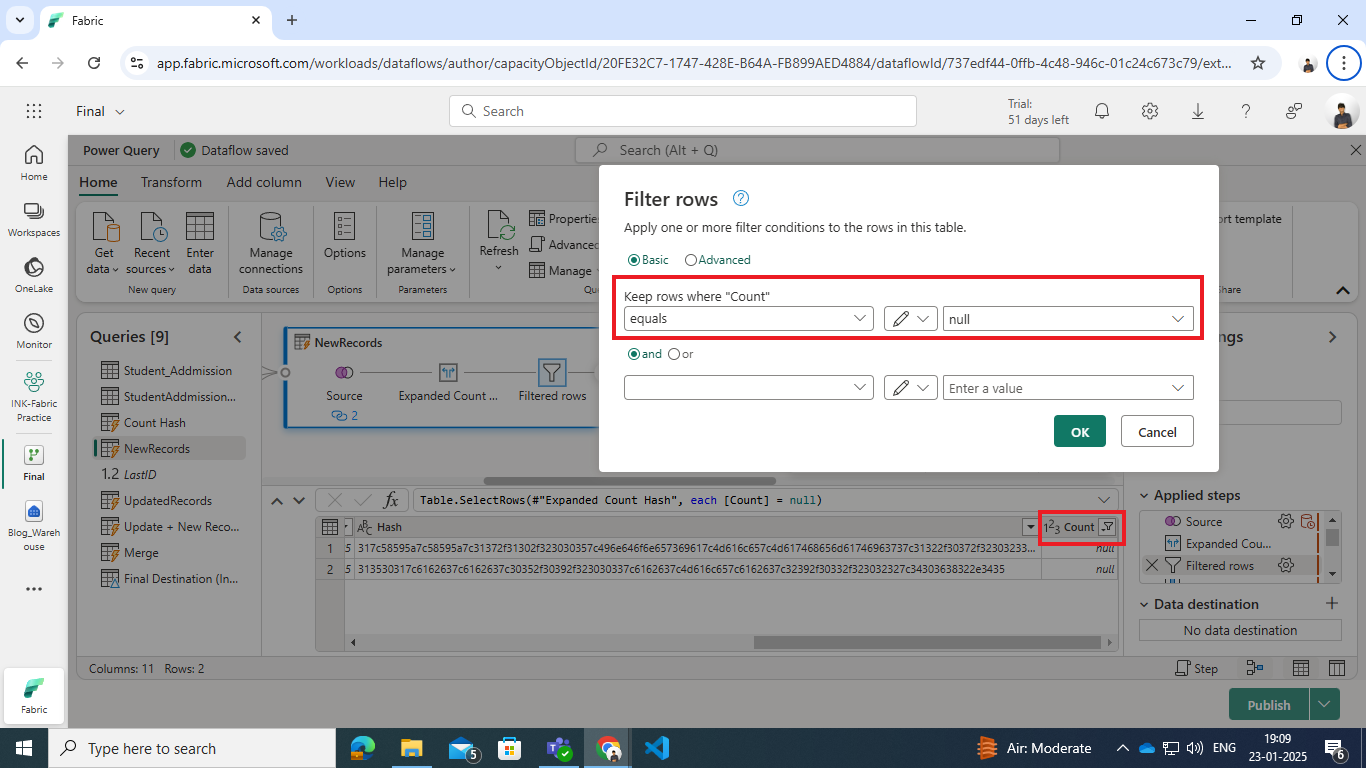
- Expand and Filter:
- Expand the Count Hash column to bring in the count values.
- Filter rows where the Count Hash column is null—these rows represent new records.
- Remove Unnecessary Columns:
- Remove the Count Hash column to simplify the dataset.
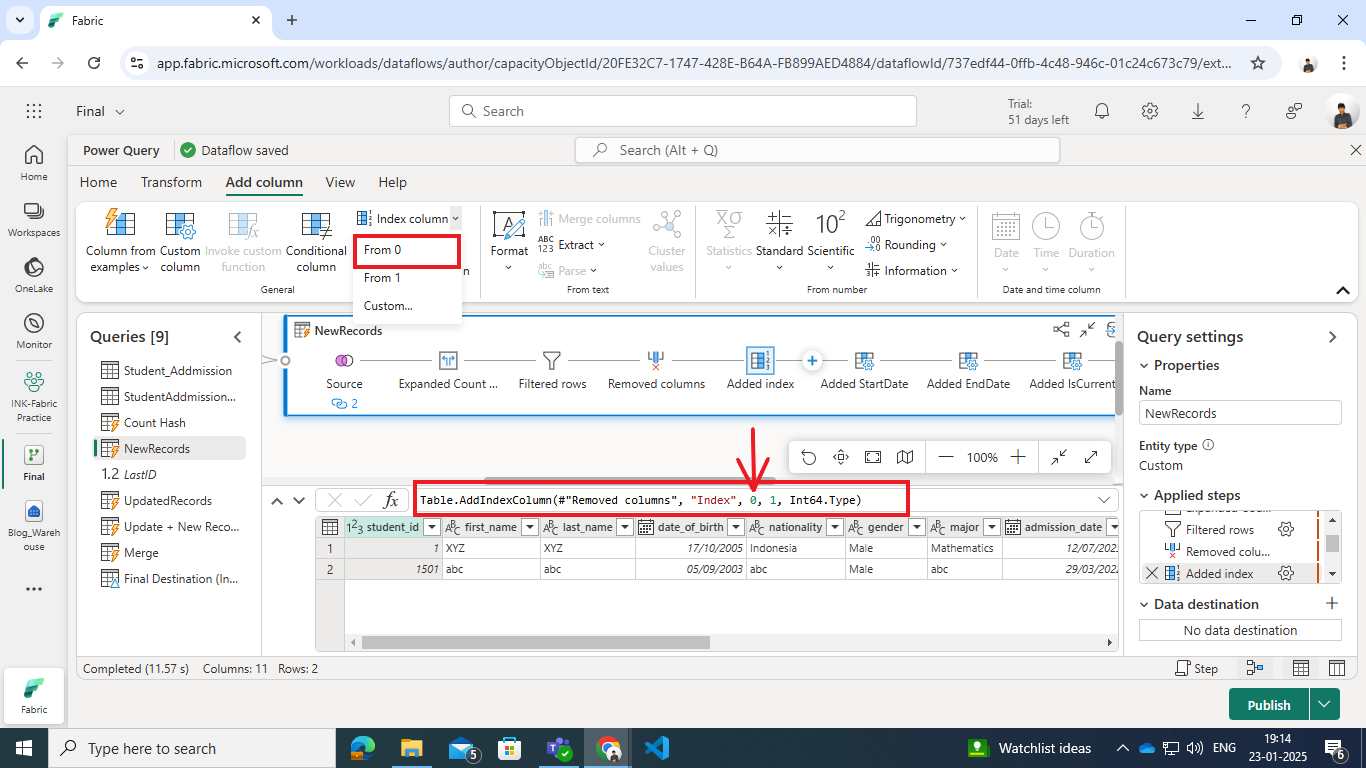
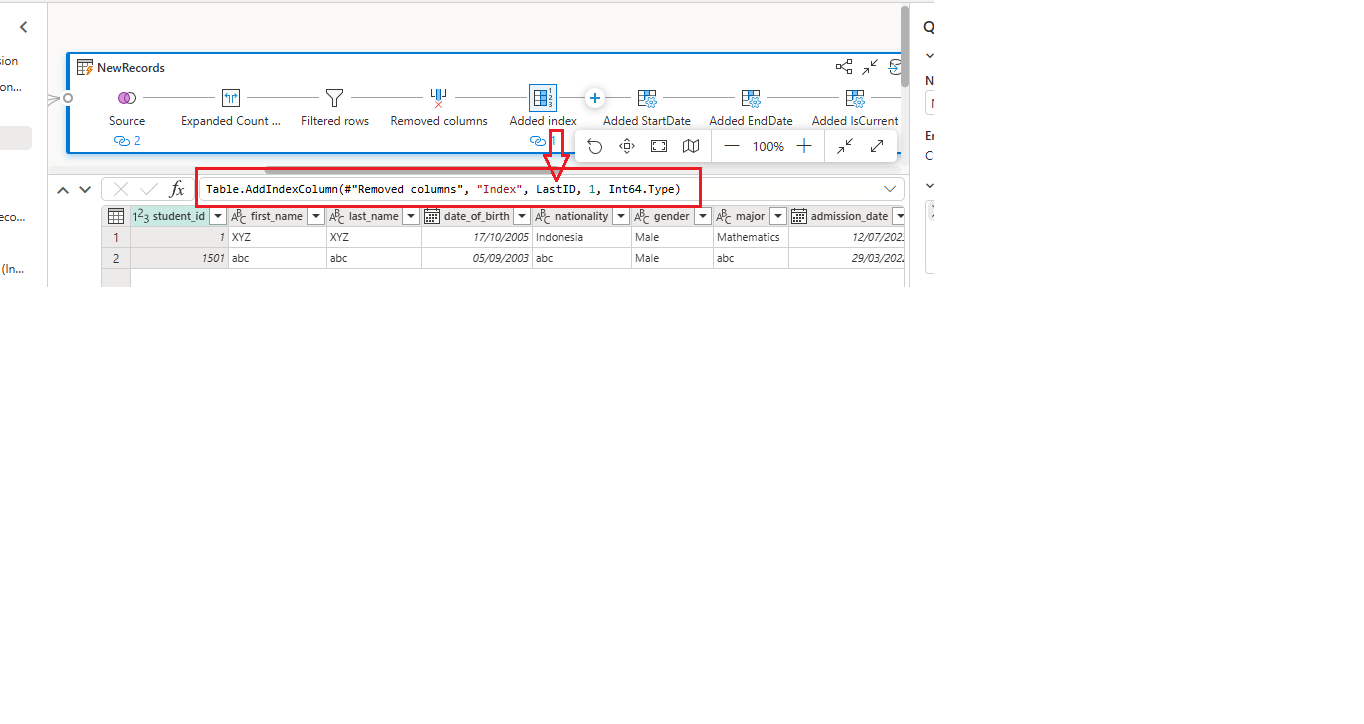
- Add Index Column:
- Add an index column starting from the maximum index value of the existing dimension table.
- Change 0 with LastID shown as bellow
-
- Change it with this:
Table.AddIndexColumn(#”Removed columns”, “Index”, LastID, 1, Int64.Type)
- Change it with this:
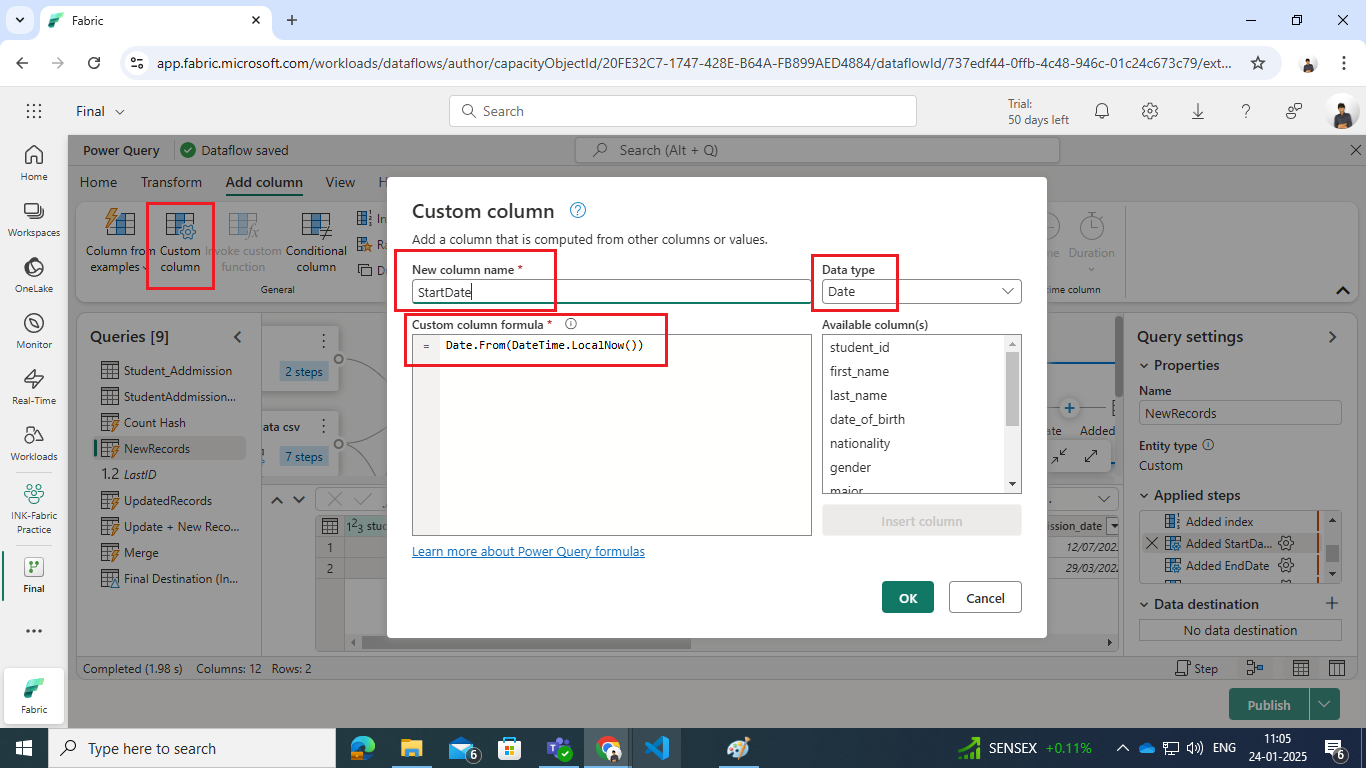
- Add Custom Columns:
- Add a StartDate column to mark the record creation date.
Formula: Date.From(DateTime.LocalNow())
- Add a StartDate column to mark the record creation date.
-
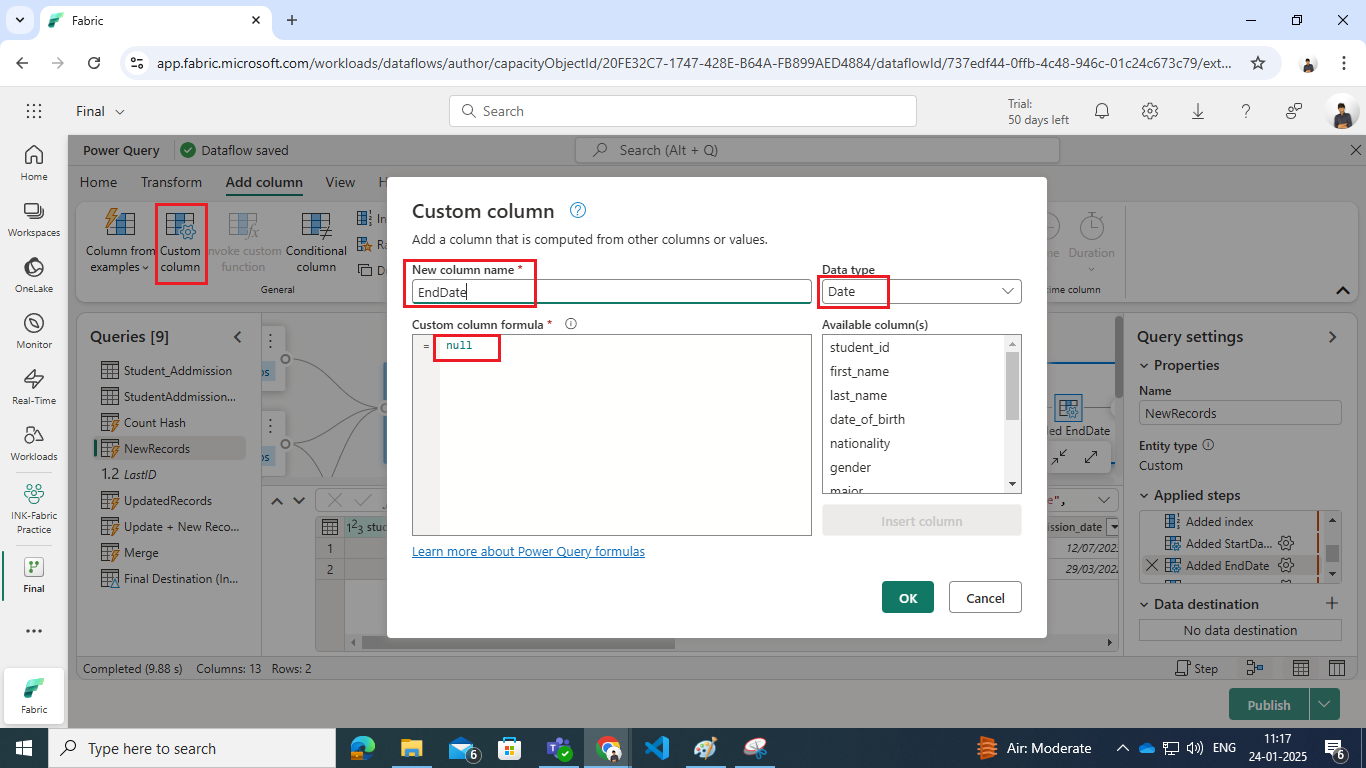
- Add an EndDate column with null values to indicate the record is active.
-
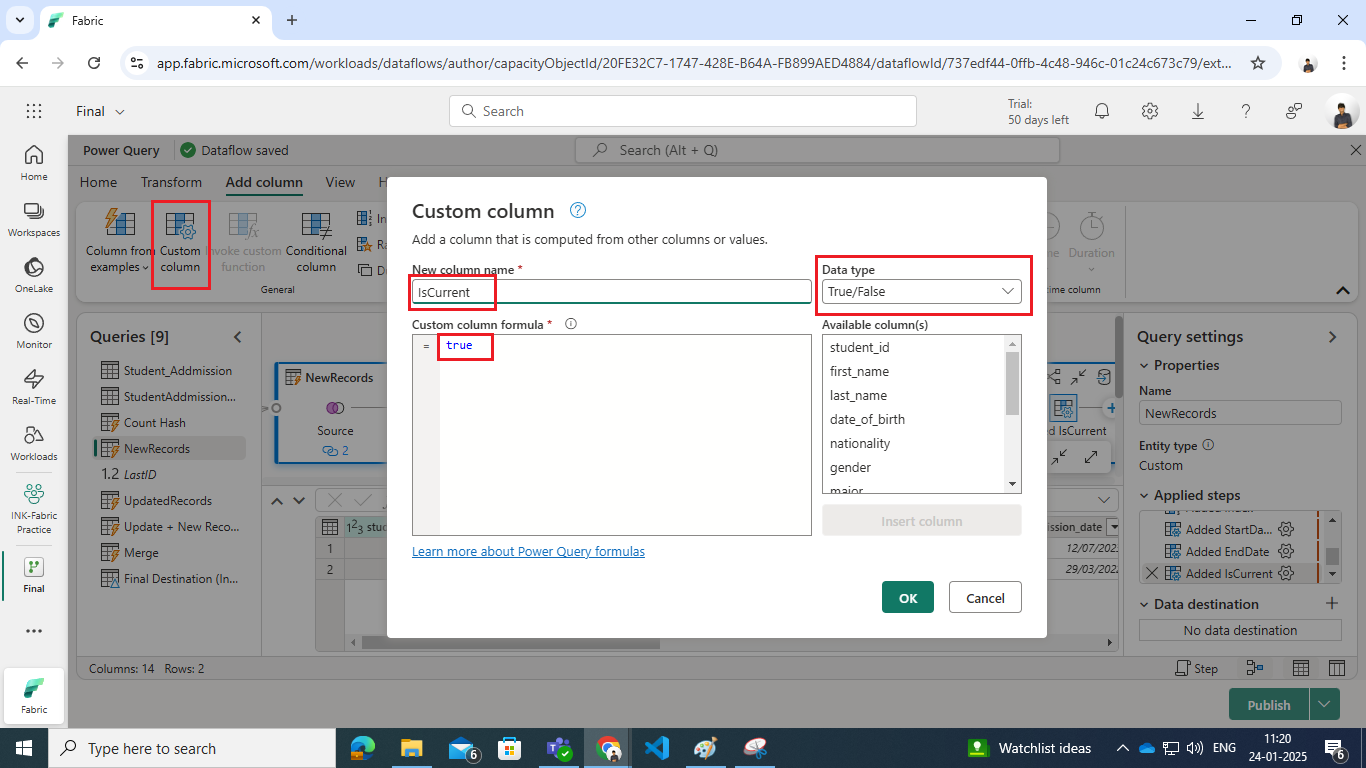
- Add an IsCurrent column with a true value to identify the record as the current active version.
Power Query code:
let
Source = Table.NestedJoin(#”StudentAddmissionData csv”, {“Hash”}, #”Count Hash”, {“Hash”}, “Count Hash”, JoinKind.LeftOuter),
#”Expanded Count Hash” = Table.ExpandTableColumn(Source, “Count Hash”, {“Count”}, {“Count”}),
#”Filtered rows” = Table.SelectRows(#”Expanded Count Hash”, each [Count] = null),
#”Removed columns” = Table.RemoveColumns(#”Filtered rows”, {“Count”}),
#”Added index” = Table.AddIndexColumn(#”Removed columns”, “Index”, LastID, 1, Int64.Type),
#”Added StartDate” = Table.TransformColumnTypes(Table.AddColumn(#”Added index”, “StartDate”, each Date.From(DateTime.LocalNow())), {{“StartDate”, type date}}),
#”Added EndDate” = Table.TransformColumnTypes(Table.AddColumn(#”Added StartDate”, “EndDate”, each null), {{“EndDate”, type date}}),
#”Added IsCurrent” = Table.TransformColumnTypes(Table.AddColumn(#”Added EndDate”, “IsCurrent”, each true), {{“IsCurrent”, type logical}})
in
#”Added IsCurrent”
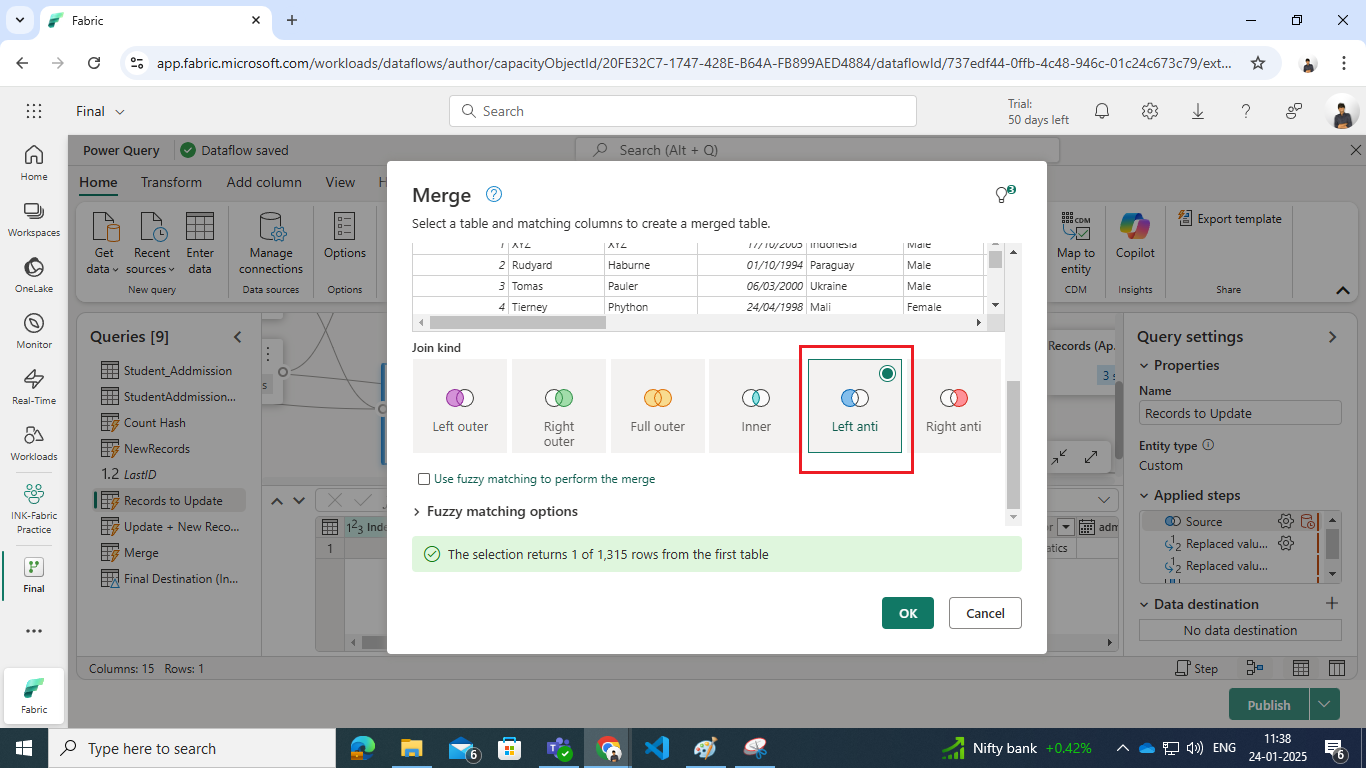
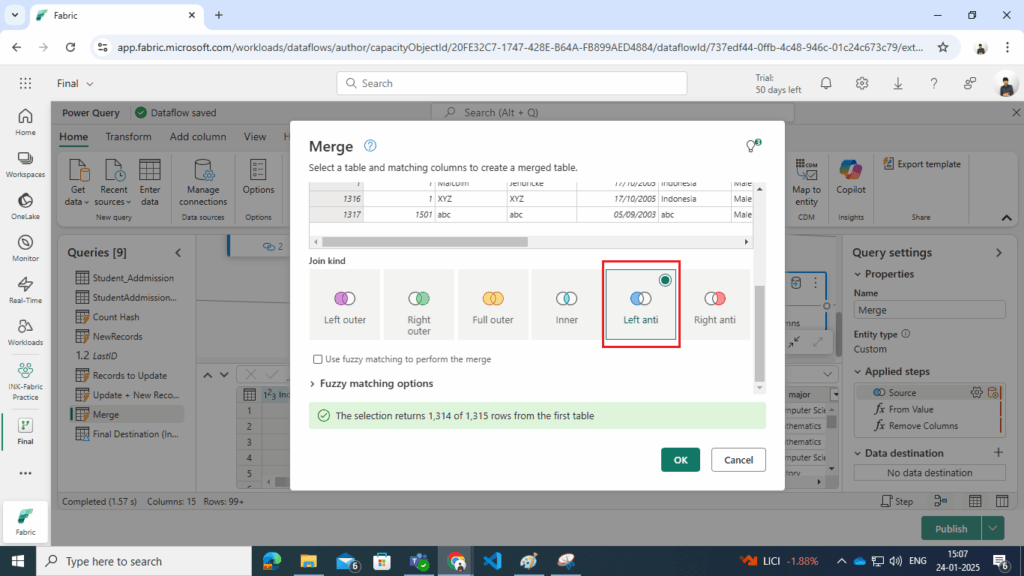
Step 6: Merge Queries to Identify Updated Records
After identifying new records, the next step involves marking existing records in the dimension table as inactive when updates occur. The following steps were taken:
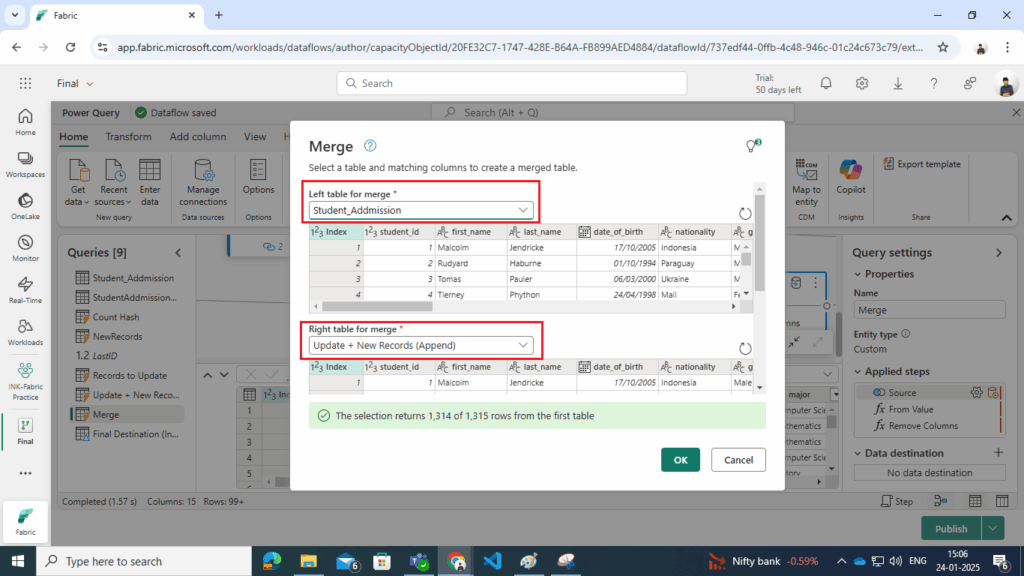
- Merge Dimension Table with Source Data:
- Use the Student_Addmission (dimension table) and Student CSV (source data) in a new query.
- Perform a Left Anti Join on the Hash column to identify dimension table records that no longer match the source data.
- It identifies records in the dimension table that do not have a matching hash in the source data, indicating they need to be updated.
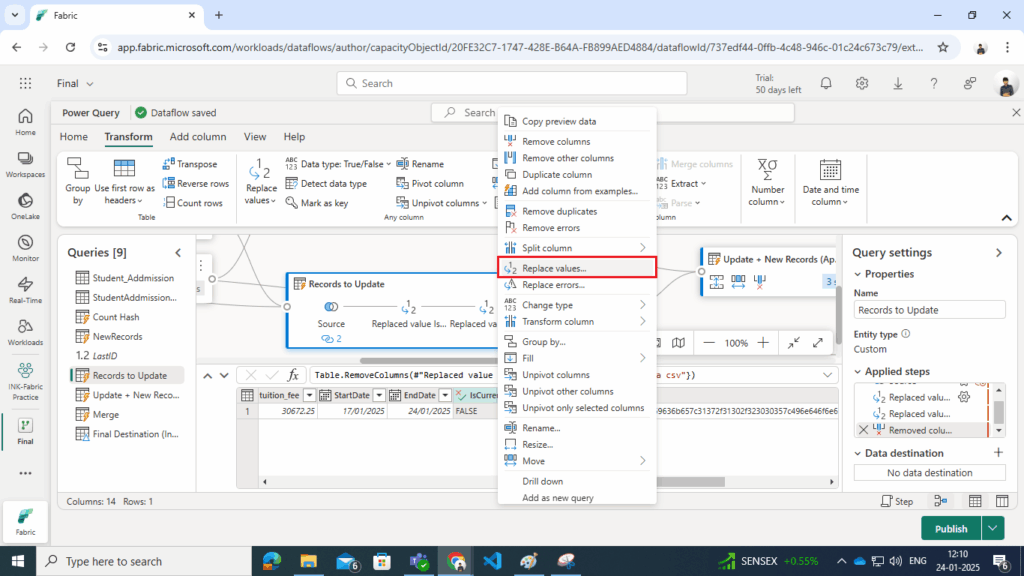
- Update IsCurrent Column:
- Replace the value of IsCurrent from true to false for these records.
- Select a IsCurrent column and right click on it
- Replace the value of IsCurrent from true to false for these records.
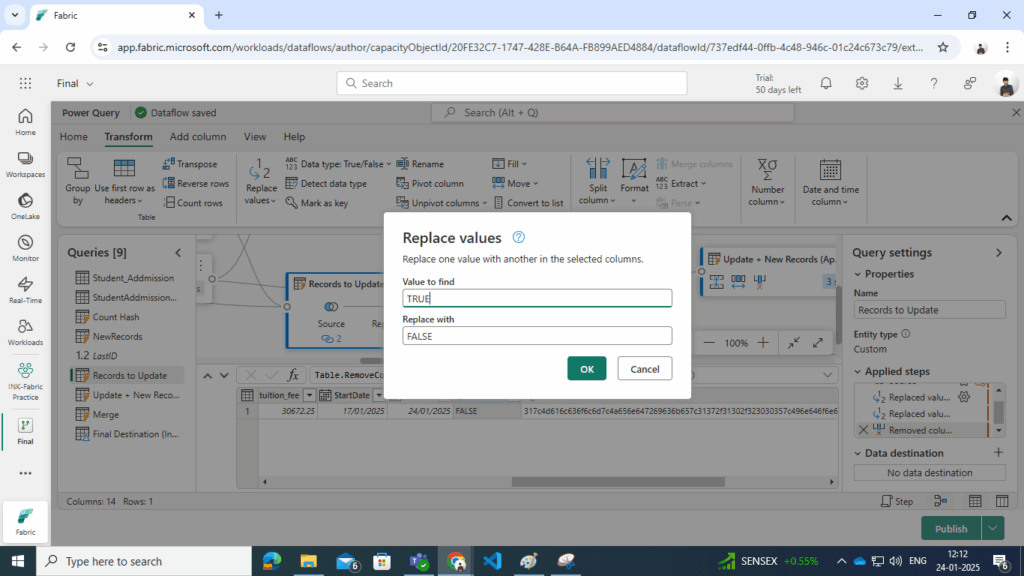
- Update EndDate Column:
- Set the EndDate column from null to the current date to mark the record as inactive.
- First replace value of EndDate from null to any temp date and then replace that temp data with formula as shown below : Date.From(DateTime.LocalNow())
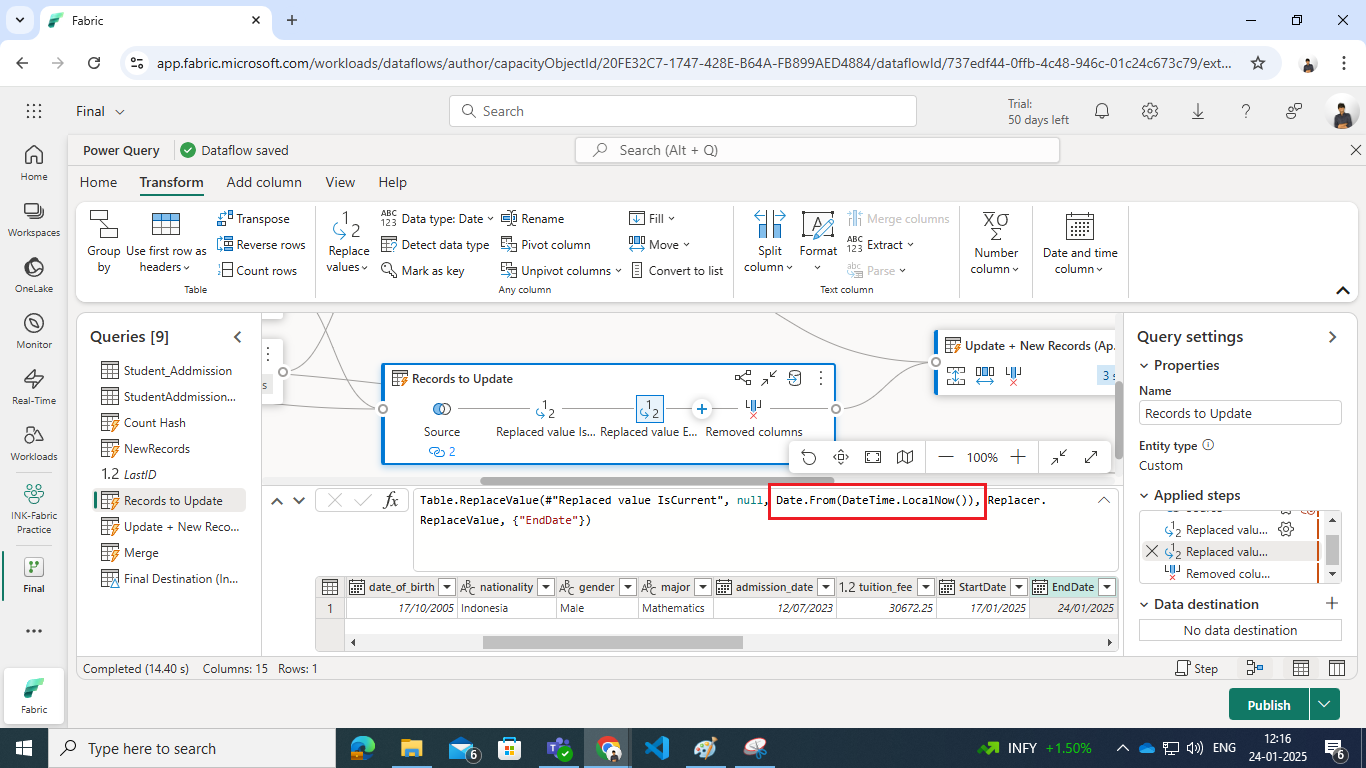
- Remove Unnecessary Columns:
- Eliminate any columns brought in from the source data to keep the dataset clean.
This ensures that all records in the dimension table reflect their historical validity and are appropriately marked as inactive when superseded by new data.
Power Query code:
let
Source = Table.NestedJoin(Student_Addmission, {“Hash”}, #”StudentAddmissionData csv”, {“Hash”}, “StudentAddmissionData csv”, JoinKind.LeftAnti),
#”Replaced value IsCurrent” = Table.ReplaceValue(Source, true, false, Replacer.ReplaceValue, {“IsCurrent”}),
#”Replaced value EndDate” = Table.ReplaceValue(#”Replaced value IsCurrent”, null, Date.From(DateTime.LocalNow()), Replacer.ReplaceValue, {“EndDate”}),
#”Removed columns” = Table.RemoveColumns(#”Replaced value EndDate”, {“StudentAddmissionData csv”})
in
#”Removed columns”
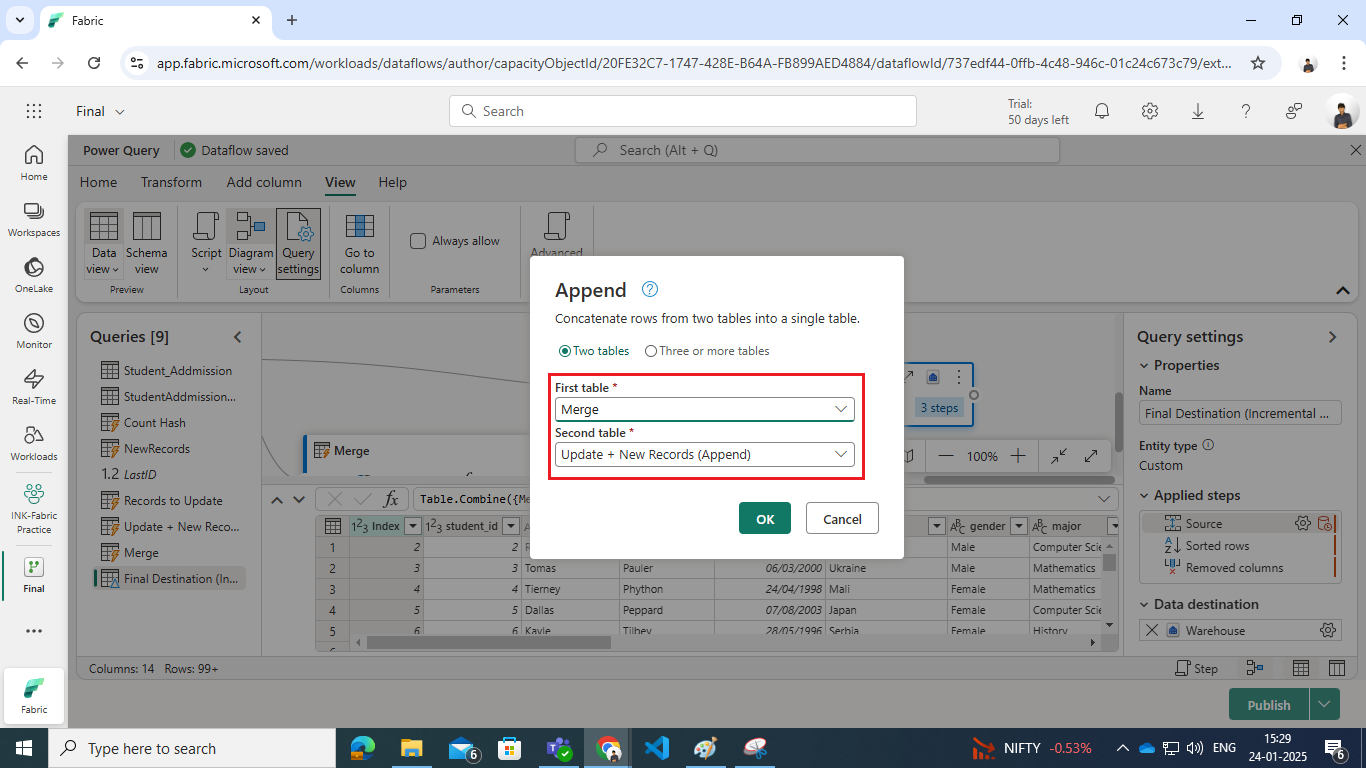
Step 7: Append Updated Records and New Records
Once the updated and new records are identified, the next step is to combine these datasets. The following steps were followed:
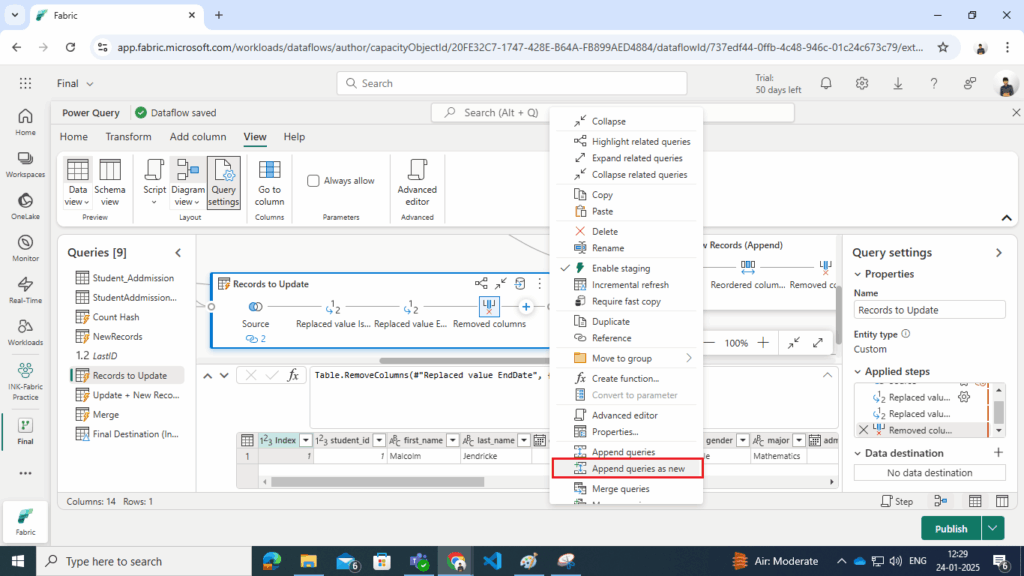
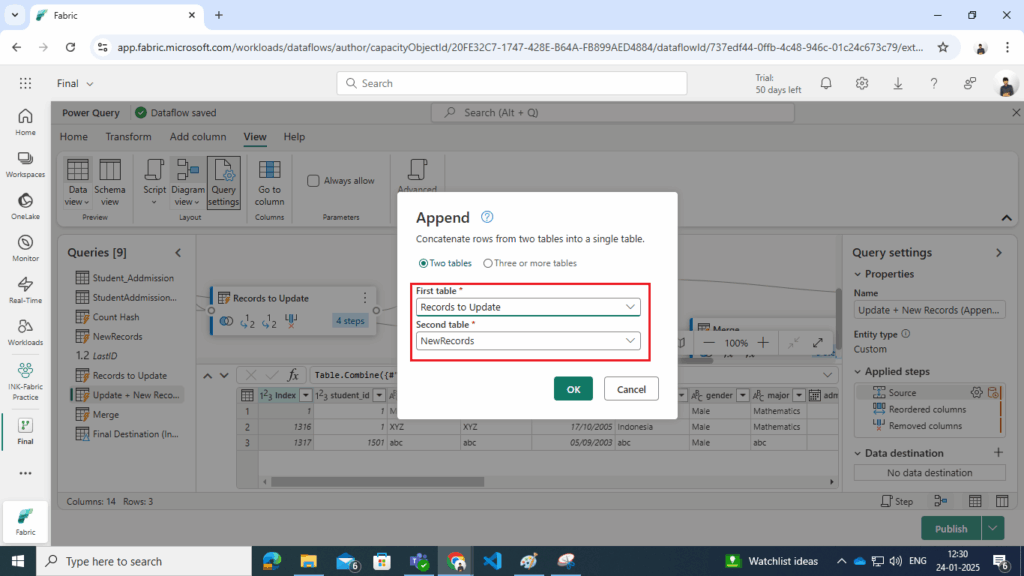
- Append as New Query:
- Use the Append Queries as New option in Power Query.
Name query as Update + New Records (Append) - Select the Records to Update query (updated records) and the NewRecords query (new records) for appending.
- Use the Append Queries as New option in Power Query.
- Reorder Columns:
- Ensure the columns are in the desired order for consistency and usability.
- Remove Unnecessary Columns:
- Remove columns that are no longer required, such as the Hash column, to clean up the dataset.
Power Query code:
let
Source = Table.Combine({#”Records to Update”, NewRecords}),
#”Reordered columns” = Table.ReorderColumns(Source, {“Index”, “student_id”, “first_name”, “last_name”, “date_of_birth”, “nationality”, “gender”, “major”, “admission_date”, “tuition_fee”, “StartDate”, “EndDate”, “IsCurrent”, “Hash”}),
#”Removed columns” = Table.RemoveColumns(#”Reordered columns”, {“Hash”})
in
#”Removed columns”
Step 8: Merge to Identify Remaining Records
After appending updated and new records, the next step involves identifying any remaining records in the dimension table that were not part of the updated or new records. The following steps were taken:
- Merge Dimension Table with Appended Records:
- Use the Student_Addmission (dimension table) and the Update + New Records (Append) query in a new query.
- Perform a Left Anti Join on the Index column to identify dimension table records that do not exist in the appended dataset.
- Convert Results to Table:
- Use Table.FromValue to transform the result into a structured table format.
- Remove Unnecessary Columns:
- Remove columns that are not needed, such as nested tables or functions.
Power Query code:
let
Source = Table.NestedJoin(Student_Addmission, {“Index”}, #”Update + New Records (Append)”, {“Index”}, “Append”, JoinKind.LeftAnti),
#”From Value” = Table.FromValue(Source),
#”Remove Columns” = Table.RemoveColumns(#”From Value”, Table.ColumnsOfType(#”From Value”, {type table, type record, type list, type nullable binary, type binary, type function}))
in
#”Remove Columns”
Step 9: Append Records
The final step combines the remaining records with the appended records to produce the final dataset. The following steps were taken:
- Combine Remaining Records with Updated + New Records:
- Use the Append Queries as New option.
- Select the Merge query (remaining records) and the Update + New Records (Append) query (appended records).
- Sort Records by Index:
- Sorts the combined dataset by the Index column in ascending order. This ensures that records are displayed in a sequential and logical manner.
- Remove Unnecessary Columns:
- Remove the Hash column, as it is no longer needed for further processing.
Power Query code:
let
Source = Table.Combine({Merge, #”Update + New Records (Append)”}),
#”Sorted rows” = Table.Sort(Source, {{“Index”, Order.Ascending}}),
#”Removed columns” = Table.RemoveColumns(#”Sorted rows”, {“Hash”})
in
#”Removed columns”
Step 10: Incremental Refresh
Fabric Dataflow Gen2 supports incremental data loading, optimizing performance by processing only new or modified records. Key aspects include:
- Filter Column: Use the StartDate field to identify records within a specific time range.
- Windowing: Define a refresh window (e.g., one month) to limit the data processed.
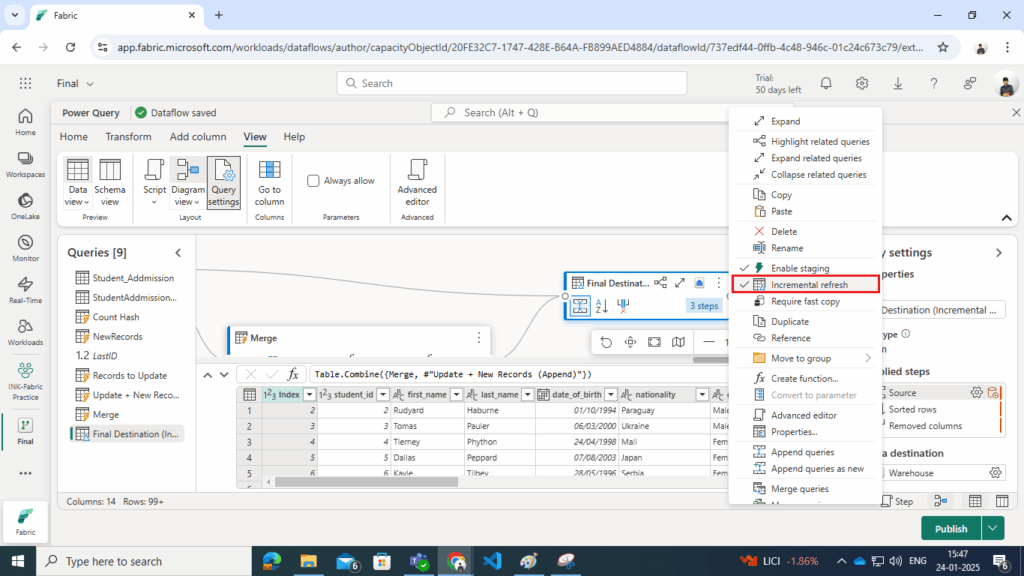
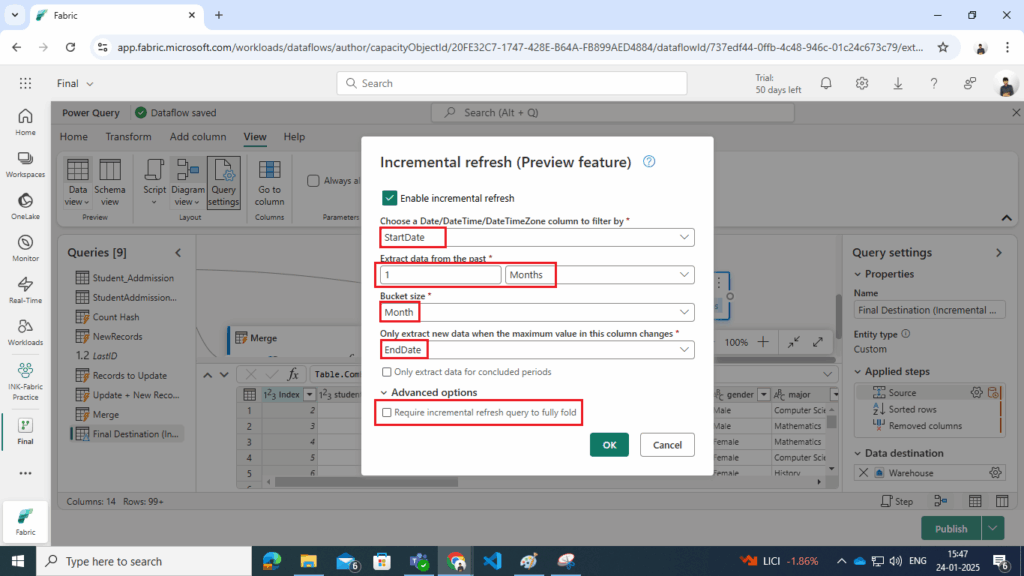
Incremental refresh ensures the pipeline efficiently handles large datasets without reprocessing the entire dimension table.
Step 11: Write to Final Destination
The final dataset is written back to the dimension table in the warehouse. Key actions include:
- Remove Obsolete Records: Outdated records are replaced with updated versions.
- Insert New Records: Append records that represent changes or new entries.
Benefits of Using Fabric Dataflow Gen2
- Scalability: Processes large datasets efficiently using incremental loading.
- Automation: Automates complex ETL workflows with minimal manual intervention.
- Historical Accuracy: Retains complete historical records for accurate reporting and analysis.
- Flexibility: Seamlessly integrates with Microsoft Fabric’s lakehouse and warehouse components.
Conclusion
Implementing SCD Type 2 with Fabric Dataflow Gen2 simplifies managing dynamic datasets. By combining features like hash-based change detection and incremental refresh, you can efficiently handle real-world scenarios like student admissions, ensuring both historical accuracy and operational efficiency.
Whether you’re dealing with student records or other dynamic data, leveraging Fabric Dataflow Gen2 ensures a scalable and robust data solution.