Enhancements in Column, Bar and Ribbon Charts in Power BI
Microsoft Power BI continues to be a cornerstone in the BI community, with its relentless commitment to updates catering to evolving business needs. The latest eagerly awaited enhancements in Column, Bar, and Ribbon Charts provide users unparalleled flexibility to tailor their visualizations.
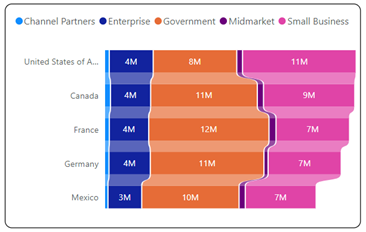
Enhancement in Stacked Column/Bar Charts:
In recent updates we get the following options to enhance Stacked Column/Bar chart.
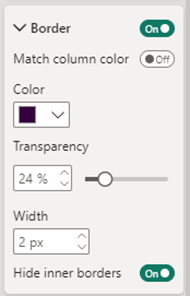
Exploring Inner Border Customization for Columns and Bars
Within the Format Pane’s Column or Bar section, you have the flexibility to toggle the visibility of inner borders. Additionally, when showcasing borders, you can fine-tune parameters such as transparency, color, and width for a tailored visual presentation.
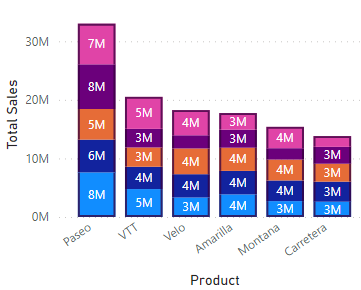
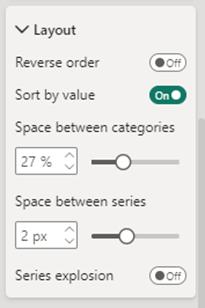
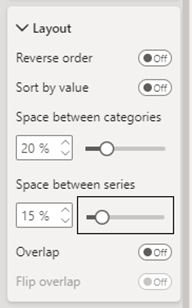
Adjusting Series and Category Spacing in the Layout Section
In the format pane’s Layout section, you have the flexibility to modify the arrangement of stacks in your chart. You can reverse the stack order, sort them based on values, fine-tune the spacing between series and categories, and explore options for Series explosion.
Enhancement in Clustered Column/Bar Charts:
Here in Clustered Column/Bar Charts we have more feasibility to enhance our chart same as Stacked column chart.
Discover the power of our services:
Microsoft Fabric, Power BI, Microsoft Business Intelligence, SQL Server, and Business Central. By the power of these services, from advanced analytics to seamless business integration, we’ve got the expertise you need to optimize operations and drive growth. Harness the potential of your data infrastructure with our comprehensive suite of solutions.
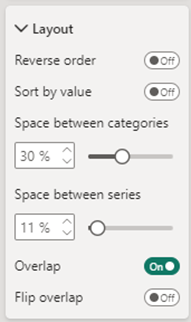
Adjusting Series Spacing
With this latest update, you can now customize the separation between clustered columns or bars by expanding the space between series. This enhancement allows you to fine-tune the spacing from 0 to 75%, catering to individual preferences and enhancing the visual appeal of your data representation. Access this feature in the format pane under the Bar/Column section by expanding the layout. Additionally, you can also modify the space between categories from this menu.
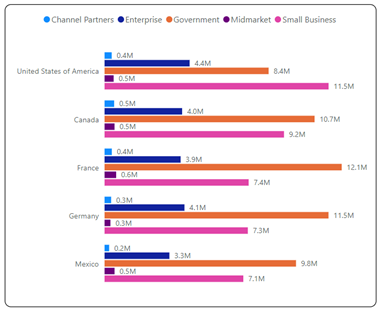
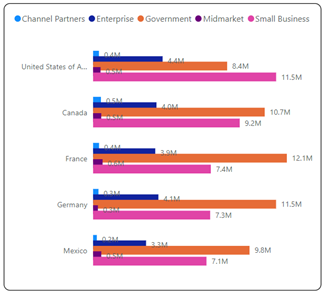
Enhanced Comparison with Overlapping
The Clustered Column/Bar chart is designed to facilitate comparisons among subcategories within the same category. With this recent update, the comparison of data series becomes more versatile and visually engaging while adhering to International Business Communication Standards (IBCS).
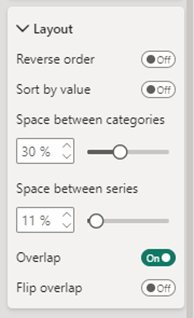
To achieve this, simply toggle the Overlap option and fine-tune the spacing between series, as illustrated below.
Flip Overlap
In addition to the option to overlap series, we now have enhanced flexibility to flip the order of the series and adjust their positions according to our specific requirements. By activating the “Flip Overlap” toggle, you can effortlessly change the sequence of the series, as outlined below.

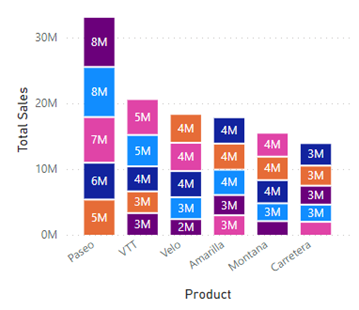
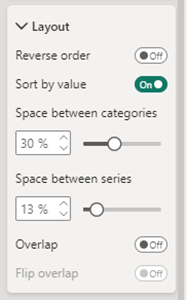
Sorting by Value
In another notable improvement, we can now arrange the series based on their values. Furthermore, with the use of a designated toggle, we can effortlessly reverse the order. This feature ensures that columns/bars align precisely and overlap in accordance with their respective ranks.
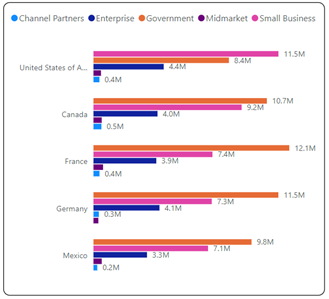
Advancements in Ribbon Charts:
In the prior update, Microsoft introduced enhancements for Ribbon charts. In the February update, this option has been expanded to include all bar and column charts. This feature empowers Power BI developers to conduct ranking analysis on exploded series using ribbons, as illustrated below.
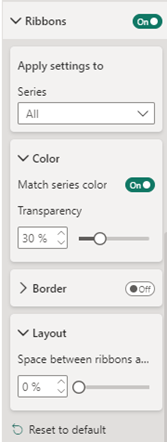
Here we are also provided with the customize the color, border, spacing, transparency of Ribbons.
In conclusion, Microsoft Power BI continues to strengthen its position as a leading BI tool with the latest enhancements in Column, Bar, and Ribbon Charts. The updates offer users unprecedented customization options, allowing for a more tailored and visually appealing representation of data. With features such as adjusting inner borders, modifying space between series and categories, and innovative options in Clustered Column/Bar Charts, Power BI empowers developers to create dynamic and insightful visualizations that adhere to International Business Communication Standards (IBCS). The extended Ribbon Charts functionality further enhances the tool’s versatility, enabling ranking analysis on exploded series with detailed customization capabilities. These advancements underscore Power BI’s commitment to providing a user-friendly and powerful solution for diverse business needs.
Know the number of records in any Dataverse entity or table.
https://inkeysolutions.com/entity-record-counter
ATM Inspection PowerApp to ease ATM inspection and report generation process.
https://inkeysolutions.com/microsoft-power-platform/power-app/atm-inspection
Insert data into Many-to-Many relationship in Dynamics CRM very easily & quickly, using the Drag and drop listbox.
http://inkeysolutions.com/what-we-do/dynamicscrmaddons/drag-and-drop-listbox
Comply your Lead, Contact, and User entities of D365 CRM with GDPR compliance using the GDPR add-on.
https://inkeysolutions.com/microsoft-dynamics-365/dynamicscrmaddons/gdpr
Create a personal / system view in Dynamics CRM with all the fields on the form/s which you select for a particular entity using the View Creator.
http://inkeysolutions.com/what-we-do/dynamicscrmaddons/view-creator