How to Use new reports and demo data for financial reporting in Microsoft Dynamics 365 Business Central
Introduction
Microsoft Dynamics 365 Business Central is a powerful ERP solution designed to improve efficiency across various business functions. Understanding your company’s financial health is crucial, and Microsoft Dynamics 365 Business Central has introduced new features in 2024 Released Wave 2 to help with this. The latest update includes new reports and demo data, making it easier to generate and analyze financial information. This new functionality can help the user get a clearer picture of their company’s financial status and trends.
Business Value
These new features offer several benefits:
- More Reporting Options: The user now has access to five new reports, including Trial Balance and various Balance Sheet and Income Statement formats. This provides a broader view of their financial data.
- Customizable Reports: The user can use the new row and column definitions to create over 25 unique reports tailored to your needs.
- Better Data Insights: By generating demo data, the user can see how these reports will look with real-world data, helping the user understand and analyze their financial situation better.
- Enhanced Financial Analysis: The new reports and definitions support detailed analysis and comparison, improving their ability to make informed decisions.
Requirement
To make the most of these new features, consider how effectively users can use them to improve their financial reporting and analysis.
Prerequisites
- Using the latest version of Microsoft Dynamics 365 Business Central.
- Access rights to view and use the new financial reports and demo data.
Solution (Implementation Steps)
Access New Reports:
- Users need to search for Financial Reporting using the search icon in the top right corner, then navigate to the Financial Reporting Page in Business Central.
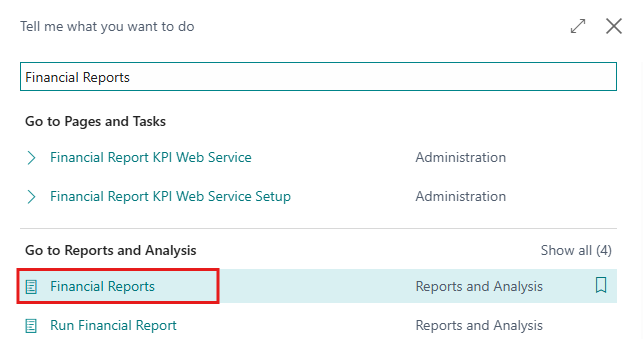
- On the Financial Reporting page, users can see the updated reports. They can choose from the new report types available:
Name Description TB Trial Balance BS DET Balance Sheet Detailed BS SUM Balance Sheet Summary IS DET Income Statement Detailed IS SUM Income Statement Summary 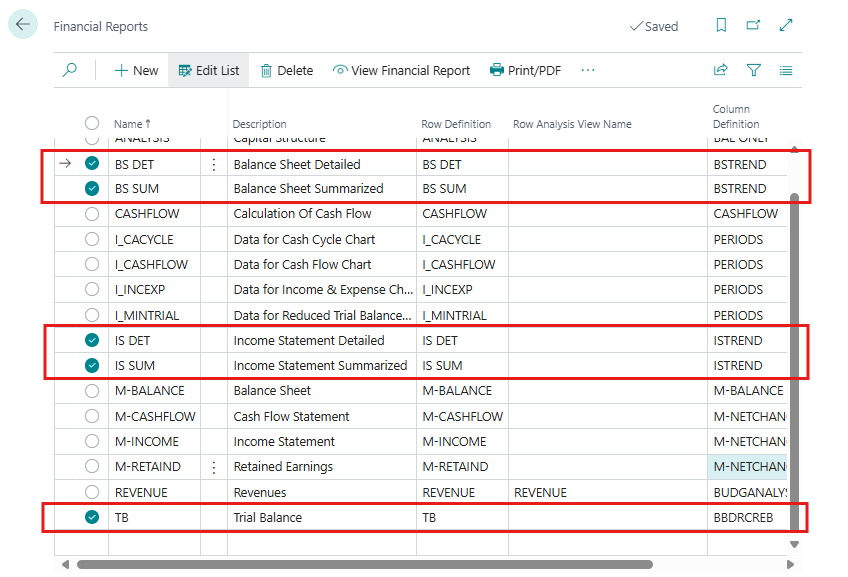
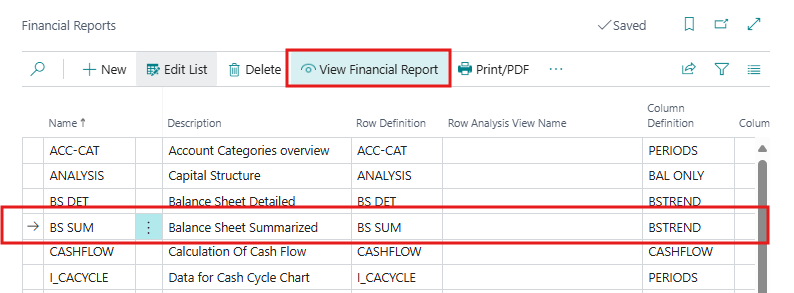
- Users need to select a report by clicking on it, then click the View Financial Report option to see the report definitions. They can also click the Print/PDF option in the menu bar above to print the financial report.
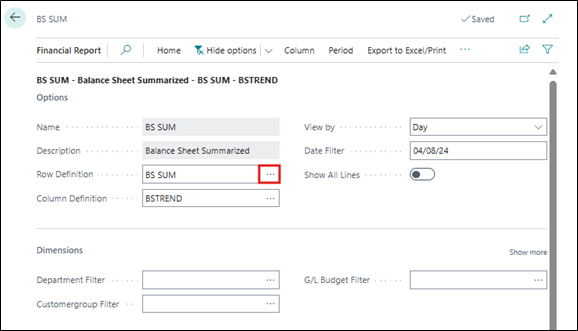
- This will open the detailed setup page of the selected BS SUM report, where users can see the Row Definition and Column Definition for the report. Users can also modify these definitions according to their requirements.
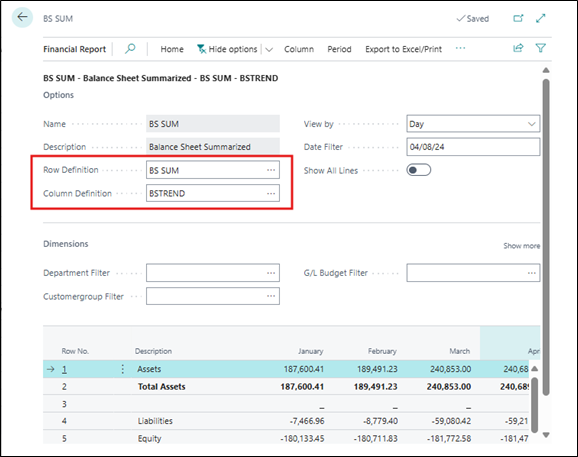
- In the new Wave 2 update, Microsoft introduced 5 new Row definitions and 12 Column definitions. Users can combine these to create over 25 new reports. Here is the list of Column Definitions:
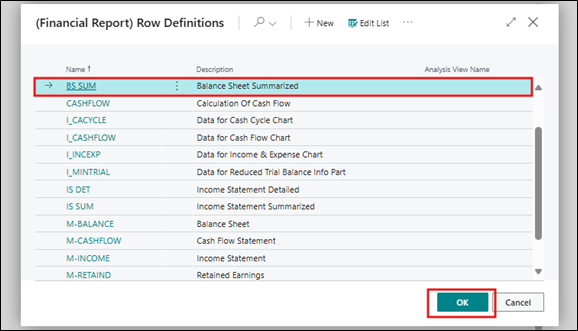
Name Description BBDRCREB TB Beginning Balance Debits Credits Ending Balance BSTREND BS 12 Months Balance Trending Current Fiscal Year CB BS Current Month Balance CB V PB BS Current Month Balance v Prior Month Balance CB V SPYB BS Current Month Balance v Same Month Prior Year Balance CNC IS Current Month Net Change CNC BUD IS 12 Months Net Change Budget Only CNC V PNC IS Current Month Net Change v Prior Month Net Change CNC VSPYNC IS Current Month Net Change v Same Month Prior Year Net Change CNCVPNCYOY IS Current Month v Prior Month for CY and Current Month v Prior Month for PY CVC YTDBUD IS Current Month v Budget Year to Date v Budget and Bud Total and Bud Remaining ISTREND IS 12 Months Net Change Trending Current Fiscal Year - Users can choose a Row definition according to their requirements by clicking on the three dots in the Row Definition fields.
- Select any new Row definition from the list and click on OK
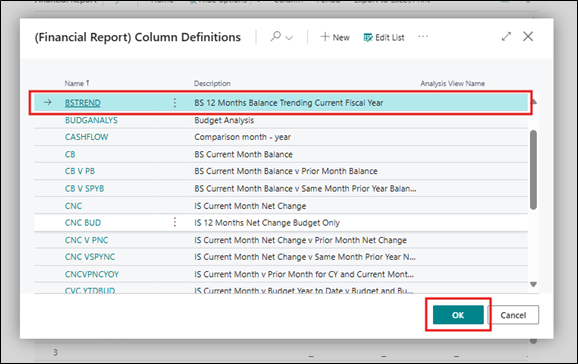
- Users can also choose a column definition according to their requirements by clicking on the three dots in the Column Definition fields.

- Select any new Column definition from the list and click on OK
- This will change the financial report structure as per their needs using this new column and row definition. To print this financial report, click on Export to Excel/Print > Print… option from above menu bar.
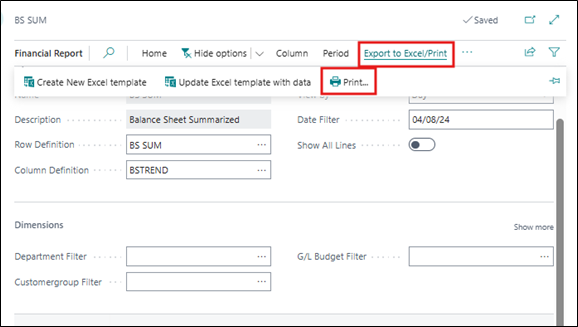
- This will open Run Financial Report batch job, users need to select the Starting Date and Ending Dates, then click the Preview & Close button to preview the financial report. Alternatively, they can print the report by clicking the Print button on the batch job page.
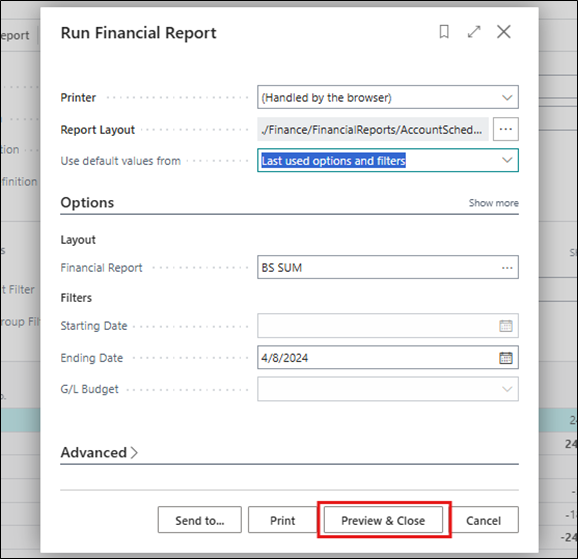
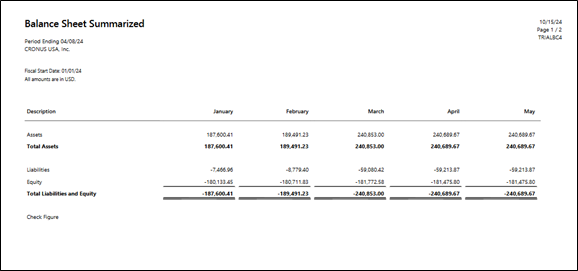
- Users can see a preview of the selected financial report.
Note: –
If user is using a version for a country other than the US, map the new row definitions to your chart of accounts to make sure the reports show the correct data.
Conclusion
The new reports and demo data in Microsoft Dynamics 365 Business Central are designed to give you a clearer and more detailed view of your financial status. By using these new tools, you can create tailored reports, analyze financial trends, and make better-informed business decisions. This update aims to enhance your financial reporting process and provide deeper insights into your company’s financial performance.