
Introducing Explore this data feature in PowerBI service
WebSiteAdmin, April 2, 2024829 Views
In Power BI, users often find the need for spontaneous exploration of their data, particularly when gaining access to a new semantic model or data source. Whether it’s an analyst seeking to familiarize themselves with the dataset or a business user with a specific question requiring immediate answers for a presentation, the conventional approach of building a new report from scratch can pose a significant barrier. Overcoming this hurdle, users can now effortlessly delve into ad-hoc data exploration within Power BI, enabling quick insights and screenshots without the cumbersome task of creating an entire report for preliminary investigations or precise information retrieval. This streamlined process enhances the efficiency of data-driven decision-making and facilitates a seamless transition from data exploration to actionable insights.
Challenges Faced:
Before the introduction of this feature, we used to export the data to Excel using the Analyze in Excel feature available in Power BI service and then we used to create basic pivot tables and other charts with the required filters to get the answers to our questions. This was a time-consuming process.
Benefits of “Explore this data” feature:
This feature is a time-saving boon for analysts and non-Power BI savvy end users alike. Instead of exporting data to Excel for basic insights, users can now efficiently explore data patterns within the Power BI service itself. This streamlined process eliminates the need for external tools, making data exploration more intuitive and focused, particularly beneficial when faced with numerous visuals that may otherwise cause confusion.
Implementation:
Implementation steps includes:
- Find a dataset you would like to explore
- Build the matrix or any other visual by adding the fields and values from the semantic model to the visual
- Add filters if required to explore the data in more detail and use various options available
- Save your exploration and share within your organization or with required people
Now, let’s walk through to the step-by-step process:
Go to Power BI service and select the dataset you want to explore. After clicking on the (…), you will find this option Explore this data (preview).

After clicking on the option, you will have the below screen on your machine.

Let’s walk through each option we have in detail:
Discover the power of our services:
Microsoft Fabric, Microsoft Power BI Consulting, Microsoft Business Intelligence, Microsoft SQL Server, and Dynamics 365 Business Central. By the power of these services, from advanced analytics to seamless business integration, we’ve got the expertise you need to optimize operations and drive growth. Harness the potential of your data infrastructure with our comprehensive suite of solutions.
Save:
This option has 2 options:
- Save: You can name the exploration, pick a workspace to save it to, and add a sensitivity label, if applicable. (You can only save explorations to workspaces in a Premium capacity at this time.)
- Save as report: You may want to save your exploration as a report instead. You can do so by choosing Save as report from the save button.
Add Filter:
This option has 2 options:
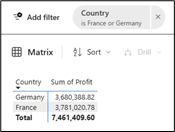
- Data in this visual: You can apply the columns as filters that we have used in the visual for more detailed and focused results.
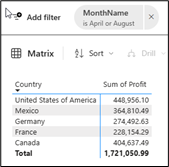
- All Data: You can also select any other filed from the dataset apart from the columns used in the visual as filters. This will work as per the relationships you have in the semantic model.
Drill: This can be helpful when you have used hierarchy or multiple columns/fields in the visual. You can drill down to the level you want to explore the data.
This option has 2 main options:

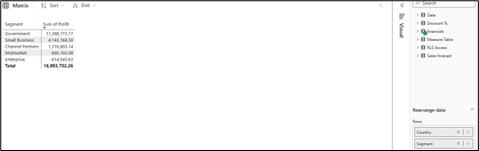
- Go to next level: If you have plotted multiple columns in the visual, then you can go to the next level to explore the data using another column/field.
If you click on this option, the visual will show the data based on the second column (Segment) used in the visual.
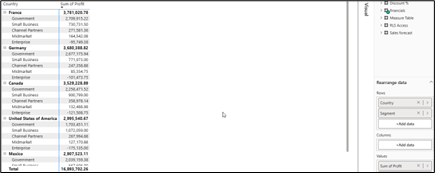
- Expand one level down: If you have plotted multiple columns in the visual, then you can expand the level to get the second column as a subcategory of the first column.
If you click on this option, the visual will show the data in a hierarchical manner based on the columns used in the visual.
Canvas: You can use this area to plot different columns and calculations/measures in a matrix visual to explore the dataset.
Remove Filters: This option is used to remove all the filters applied in the exploration.
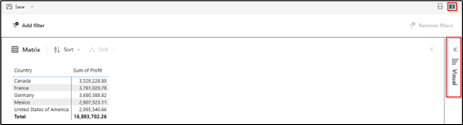
Switch Layout: This option is used to switch the position of the visual pane vertically or horizontally.
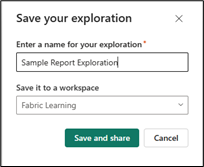
Share: This option is used to save your exploration to the workspace and share it with the users. Once you click on the share option, you will find the window below where you must assign the name and workspace for the exploration.
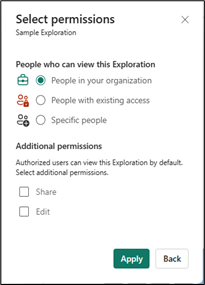
Once you click on the Save and share button, you will find the window below where you can add the users you want to share the exploration with additional permissions.
Choose Data: This option helps you to add various columns and calculations/measures to your explorations.
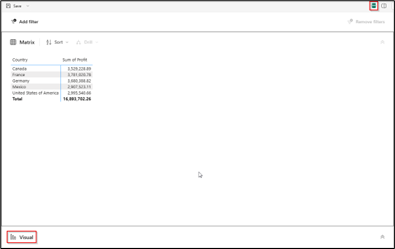
Visual: This option is used to create different visuals in the explorations apart from the default matrix visual.
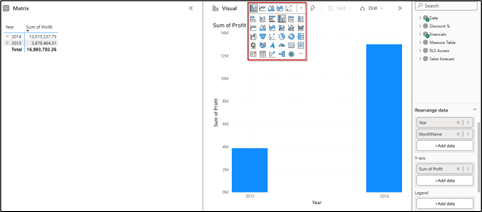
The default matrix visual will be automatically adjusted based on the drill or sort applied in the visual pane.
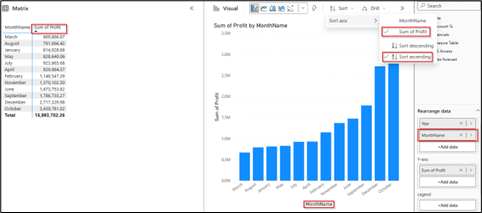
In the below image you can see that we have drilled down the column chart to one level and sorted the data based on the Sum of Profit in ascending order and based on that the matrix visual is automatically adjusted.
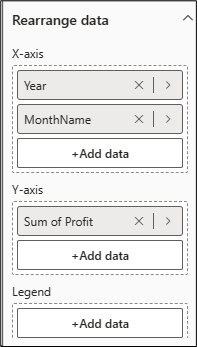
Rearrange Data: This option helps you to rearrange different columns and calculations you have used in the exploration. You can use the columns as Legend, Small multiples and Tooltip as well.
Limitations:
- Users who are creating the explorations require build permissions on the semantic model.
- The workspace should be in premium capacity to save explorations.
- **When you change the sensitivity label on the semantic model, it will not propagate to the exploration it was created on.
- Explore is not currently supported for streaming datasets.
- Exploration users need a Pro/PPU license to share.
- When sharing, the exploration author will also need to grant build permissions to the underlying semantic model so the recipient can view the exploration. If the author skips this second step, the recipient cannot see the exploration and request permissions.
- Currently, you can’t open an exploration on a mobile device in the Power BI mobile app.
- **All native visuals are supported except for: Q&A, Smart Narratives, Metrics, Paginated Reports, Power Apps, Power Automate. Custom visuals support is coming soon.
Conclusion:
In conclusion, the “Explore this data” feature in Power BI Service represents a significant advancement in empowering users to interactively engage with their data. By seamlessly integrating the capabilities of Power BI Desktop within the web environment, this feature enables users to conduct ad-hoc analysis, create new visualizations, and uncover insights directly within their reports or dashboards. Ultimately, “Explore this data” enhances the accessibility and usability of Power BI Service, empowering users to make data-driven decisions with confidence and agility.
Know the number of records in any Dataverse entity or table.
https://www.inkeysolutions.com/entity-record-counter
ATM Inspection PowerApp to ease ATM inspection and report generation process.
https://www.inkeysolutions.com/microsoft-power-platform/power-app/atm-inspection
Insert data into Many-to-Many relationship in Dynamics CRM very easily & quickly, using the Drag and drop listbox.
http://www.inkeysolutions.com/what-we-do/dynamicscrmaddons/drag-and-drop-listbox
Comply your Lead, Contact, and User entities of D365 CRM with GDPR compliance using the GDPR add-on.
https://www.inkeysolutions.com/microsoft-dynamics-365/dynamicscrmaddons/gdpr
Create a personal / system view in Dynamics CRM with all the fields on the form/s which you select for a particular entity using the View Creator.
http://www.inkeysolutions.com/what-we-do/dynamicscrmaddons/view-creator


Hello there, justt became aware of your blog through Google,
aand flund that it is really informative. I’m going to wztch out for brussels.
I will appreciate if you continue this in future.
Many people will be benefited from your writing. Cheers! https://www.waste-ndc.pro/community/profile/tressa79906983/