
Switching between aggregated values and breakdown values using Field Parameters in Microsoft Power BI allows users the flexibility to choose between viewing the total amount for all categories, such as products or regions, or breaking down the amount values by specific categories. This capability through Microsoft Power BI Consulting empowers users to view aggregated sales values at a higher level or delve into more detailed categories as needed.
Implementation:
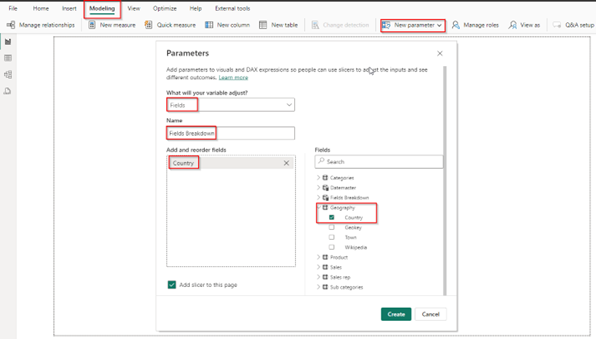
Step 1: Proceed to the “Modeling” tab and select the “New Parameter” option, followed by “Fields parameter.” Here, we name the parameter as “Fields Breakdown,” as depicted in image.
Now, we need to choose the fields between which we intend to toggle. For demonstration purposes, we selected the “Country” field from the “Geography” table. Additionally, we can select other desired fields onto the designated field section to switch between different categories.
This process automatically generates a slicer in your report, allowing you to break down the data by the selected option from the slicer.
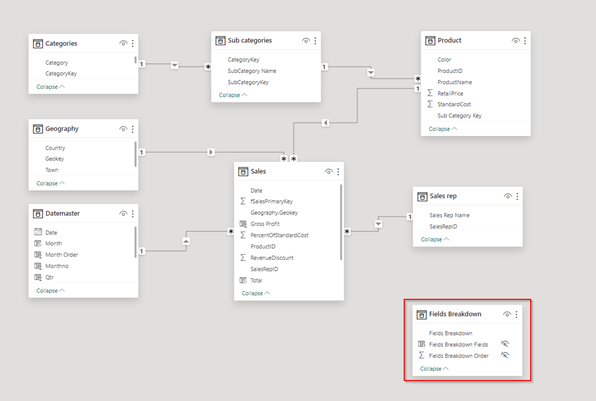
This is basically nothing else than a disconnected table in your data model shown in below image:
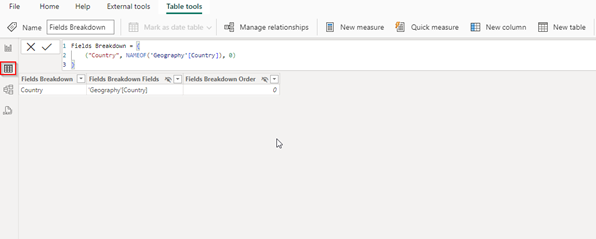
Step 2: Navigate to the data view of the fields parameter. Here, you’ll observe the first column representing the field names. Additionally, there are two extra columns: one indicating the table name and column name for reference, and another specifying the sorting order to determine the display sequence.
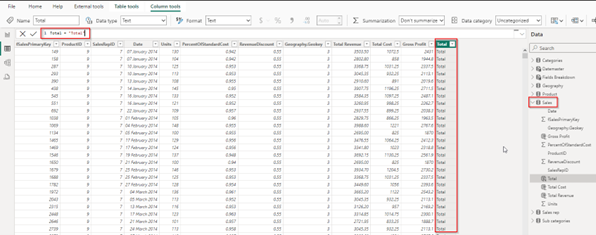
Step 3: Here, we don’t have the option to switch to the total, as the main concept is to toggle between the aggregated value and break down values by the selected categories.
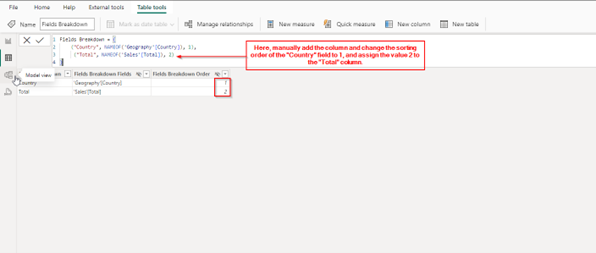
To enable this functionality, begin by creating a dummy column in your table containing just one item. Then, utilize this column in your fields parameter table, as illustrated in the image below.
Step 4: Add the newly created dummy column to the field parameter that we just established. Please note that in the image from step 2, the default starting sorting order for “Country” is 0, but here we change it to 1. Additionally, assign the sorting order of 2 to the “Total” column, as shown in the image. However, it’s worth noting that maintaining the sorting order as 0 or replacing it with 1 would also suffice.
Step 5: For demonstration purposes, added two charts: one showing the sales revenue by month, and another showing the sales revenue by product.
Microsoft Fabric, Microsoft Power BI Consulting, Microsoft Business Intelligence, Microsoft SQL Server, and Dynamics 365 Business Central. By the power of these services, from advanced analytics to seamless business integration, we’ve got the expertise you need to optimize operations and drive growth. Harness the potential of your data infrastructure with our comprehensive suite of solutions.
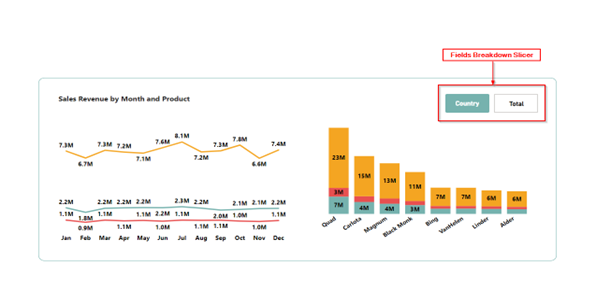
As discussed in step 1, the fields parameter automatically creates the slicer on your report view. In the image below, the slicer will display the two options.
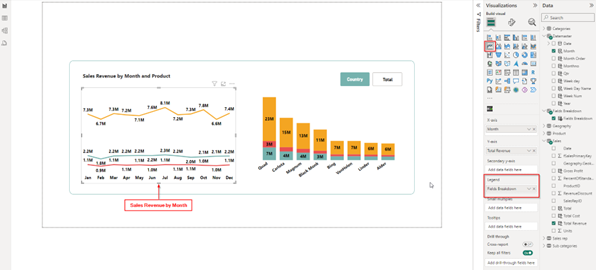
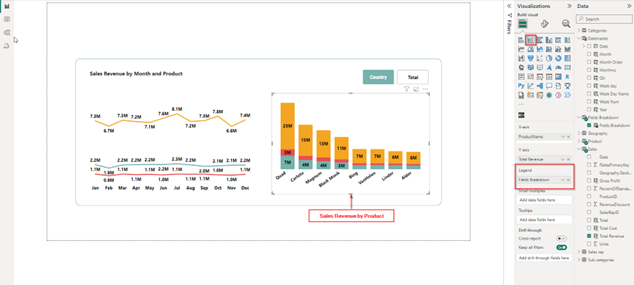
Step 6: Add the fields parameter in the legend section for both charts, as shown in the images below.
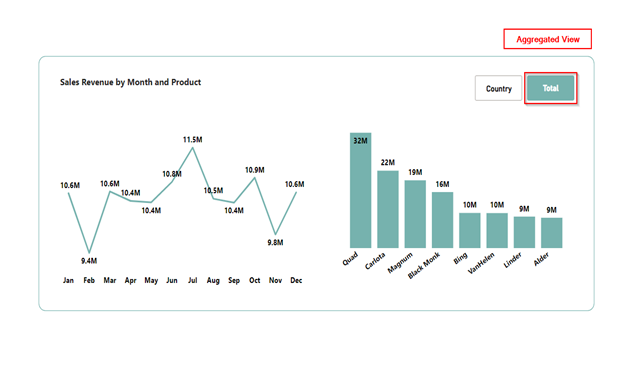
By clicking on “Total” from the slicer, it will display the total sales revenue by both month and product. This represents the charts without any filters, or in other words, the aggregated view of the data.
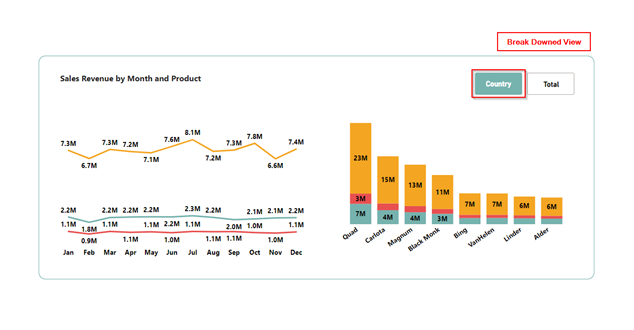
By clicking on “Country” from the slicer, the charts will display the sales revenue broken down by country. This represents the charts with filters applied, or in other words, the breakdown view of the data.
We could achieve the same functionality using bookmarks but implementing it would require adding more visuals to the report. This would lead to increased report loading times and longer refreshment times. Additionally, utilizing bookmarks would necessitate more effort compared to field parameters. As demonstrated here, we were able to create toggle buttons in just a few simple steps using field parameters. In contrast, implementing the same functionality with bookmarks would involve additional steps, potentially causing confusion.
Conclusion
In conclusion, field parameters offer a straightforward and efficient solution for achieving toggling functionality in Microsoft Power BI reports. By utilizing field parameters, users can seamlessly switch between aggregated and breakdown values, thereby enhancing the user experience and facilitating dynamic data analysis through Microsoft Power BI Consulting.
Know the number of records in any Dataverse entity or table.
https://www.inkeysolutions.com/entity-record-counter
ATM Inspection PowerApp to ease ATM inspection and report generation process.
https://www.inkeysolutions.com/microsoft-power-platform/power-app/atm-inspection
Insert data into Many-to-Many relationship in Dynamics CRM very easily & quickly, using the Drag and drop listbox.
http://www.inkeysolutions.com/what-we-do/dynamicscrmaddons/drag-and-drop-listbox
Comply your Lead, Contact, and User entities of D365 CRM with GDPR compliance using the GDPR add-on.
https://www.inkeysolutions.com/microsoft-dynamics-365/dynamicscrmaddons/gdpr
Create a personal / system view in Dynamics CRM with all the fields on the form/s which you select for a particular entity using the View Creator.
http://www.inkeysolutions.com/what-we-do/dynamicscrmaddons/view-creator
INKEY is your solution partner.
Our focus is to deliver you in-time intelligent innovative solutions ("key") for the problems in hand. Maintaining a quality standard right from the inception of a project is our top most priority.
Our team of talented professionals will execute your projects with dedication and excellence. We take ownership and accountability for the effort that goes into meeting our client’s needs.
Years of experience and proven success of delivering innovative custom solutions.


© All Rights Reserved. Inkey IT Solutions Pvt. Ltd. 2024


Leave a Reply