
Consider a scenario where your measure’s definitions are the same but the only difference is the base measures.
For example, while doing time-related calculations like MTD, YTD, QTD for 3 different calculations/measures, we need to create 3 measures for MTD, 3 measures for YTD, and 3 measures for QTD, resulting in total 9 measures such as :
Total Gross MTD = CALCULATE ([Total Gross Sales],DATESMTD ( ‘Date'[Date] ) )
Total Gross QTD = CALCULATE ([Total Gross Sales],DATESQTD ( ‘Date'[Date] ) )
Total Gross YTD = CALCULATE ([Total Gross Sales],DATESYTD ( ‘Date'[Date] ) )
Total Sales MTD = CALCULATE ([Total Sales],DATESMTD ( ‘Date'[Date] ) )
Total Sales QTD = CALCULATE ([Total Sales],DATESQTD ( ‘Date'[Date] ) )
Total Sales YTD = CALCULATE ([Total Sales],DATESYTD ( ‘Date'[Date] ) )
Total Profit MTD = CALCULATE ([Total Profit],DATESMTD ( ‘Date'[Date] ) )
Total Profit QTD = CALCULATE ([Total Profit],DATESQTD ( ‘Date'[Date] ) )
Total Profit YTD = CALCULATE ([Total Profit],DATESYTD ( ‘Date'[Date] ) )
It just creates redundant measures and thus it sometimes becomes difficult to handle such models where we have such time-related calculations for most of the measures.
Well, nowadays where there is a lot of advancement in Power BI and the external tools used for it, it seems nothing is impossible.
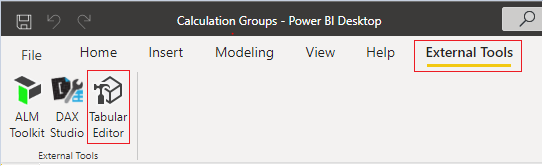
So, here we are with the way on how to reduce the number of measures for scenarios like this. For this, we would use the concept of ‘Calculation Groups’ that can be used with an external tool – Tabular Editor. It will drastically reduce the number of measures in a model. Normally, we use a Calculation Group for time-related calculations but it could be used for other situations too. For example, we want to see most of our Sales, Profit, Margin, etc. numbers for two specific regions/products/customers/etc.
To work with the Calculation Group, one must have Tabular Editor installed on the machine. If you haven’t downloaded Tabular Editor yet, please click to download the latest version here.
Let’s take an example to see how it works:
Below are the measures that I have created and for each measure, I would create measures to calculate YTD , MTD and QTD.
So, the longer route will be – creation of measure for each of the cases as below.
Base Measures
Total Gross Sales = SUM(financials[Gross Sales])
Total Profit = SUM(financials[Profit])
Total Sales = SUM(financials[ Sales])
And the time-related measures will be as below:
YTD Gross Sales = Calculate ([Total Gross Sales], DATESYTD ( 'Date'[Date] ))
YTD Profit = Calculate ([Total Profit], DATESYTD ( 'Date'[Date] ))
YTD Sales = Calculate ([Total Sales] , DATESYTD ( 'Date'[Date] ))
And the same would be for MTD and QTD as shown above, and we would end up creating 12 measures in total.
Base Measures = 3
Time related measures for each of the 3 Base Measures = 3 * 3 = 9
Total = 3 + 9 = 12
To cut-short the lengthier process, we would need to follow below steps:
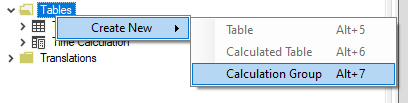
What is a Calculation Group?
A Calculation Group can apply specific calculations on top of existing DAX measures.
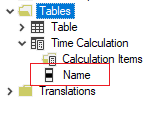
It is a table that has a single column, by default it is named as Names in Tabular Editor. You can rename the column as you like and it will be displayed on Power BI Desktop. Here I have not renamed the column name.
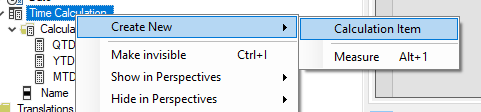
Now, right-click on the calculated group you just created and click on ‘New Calculation Item’ and add items YTD, QTD, and MTD. Define the measure using DAX and the blueprint shown below.
<Calculation Item  name>:=
CALCULATE (
    SELECTEDMEASURE(),<Dax Expression>)
Now why SELECTEDMEASURE()?
SELECTEDMEASURE() is used by expressions for calculation items to reference the measure that is currently in context.
To know more about SELECTEDMEASURE(), please refer to this link.
I have defined QTD, YTD, and MTD as below. You can define it as per your requirement.
QTD := CALCULATE (
        SELECTEDMEASURE (),
        DATESQTD ( 'Date'[Date] )
    )
YTD := CALCULATE (
    SELECTEDMEASURE (),
    DATESYTD ( 'Date'[Date] )
   )
MTD:= CALCULATE (
    SELECTEDMEASURE (),
    DATESMTD ( 'Date'[Date] )
)
It will be displayed as shown in the image below:
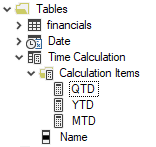
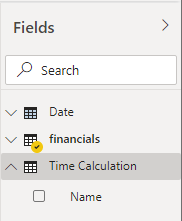
Press CTRL + S to save your work and the changes done will be applied to the connected database, i.e. Power BI Desktop report file. Close the external tool and go back to the Power BI Desktop. Here you will be able to see a separate table with a column name Names containing values of call Calculation Items we created.
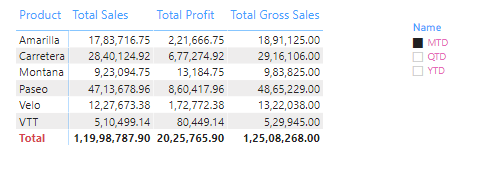
Now let’s compare the visuals of both, one using Calculation Group and the other using the normal method by creating all 9 measures.
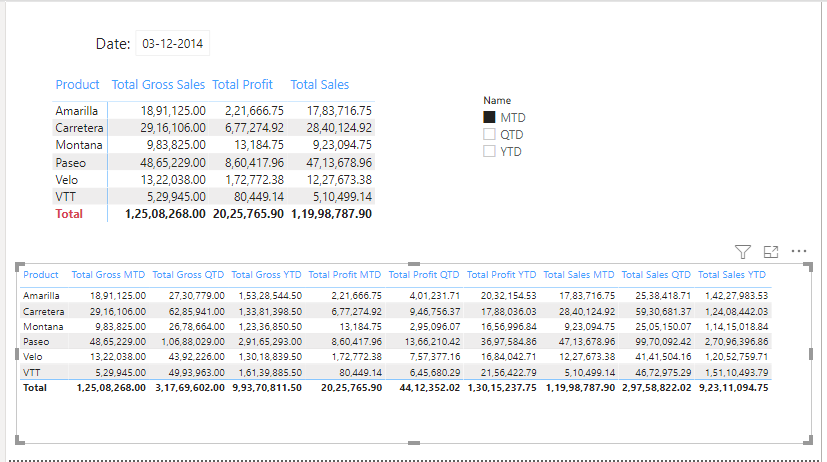
The 1st visual is using the Calculation group and the 2nd one is plotted using all 9 measures.
We can clearly see how complex it looks and it’s really difficult to understand the visual having 10 columns.
Let’s see how to achieve the visual using Calculated Groups!
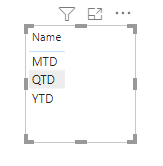
Plot the matrix with all the base measures for which you have created CALCULATION GROUP. Also, plot a slicer of the field in the Calculation Group table (here, Names).
Below is the screenshot of my demo model that will give you a complete idea.
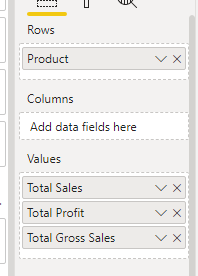
Hence, on selecting slicer values, your matrix will reflect the expected results.
Below screenshot is a visualization pane for the matrix and values contain all the measures which require respective calculation for MTD, QTD, YTD each.
Here you are done with the calculation groups. Use this method and thus reduce the number of measures in your model.
This is such an amazing tool that will make your database cleaner and organized.
Let us know if you have any questions/suggestions in the comments below.
Happy Reporting!
INKEY is your solution partner.
Our focus is to deliver you in-time intelligent innovative solutions ("key") for the problems in hand. Maintaining a quality standard right from the inception of a project is our top most priority.
Our team of talented professionals will execute your projects with dedication and excellence. We take ownership and accountability for the effort that goes into meeting our client’s needs.
Years of experience and proven success of delivering innovative custom solutions.


© All Rights Reserved. Inkey IT Solutions Pvt. Ltd. 2024


Leave a Reply