
In this blog I will show you how to create and configure Interactive experience dashboards in model driven apps.
The Interactive dashboards are fully configurable and security-role based and deliver information across multiple streams in real time.
The Interactive dashboards have two forms: multi-stream and single-stream.
Multi-Stream dashboards can be table-specific dashboards.
The multi-stream dashboards display data in real time over multiple data streams.The data flows from various views or queues, such as My Activities, My Cases, etc.
The single-stream dashboards display real-time data over one stream based on a table view or queue.In these dashboards we can add only one stream.
Multi-stream and single-stream dashboards contain interactive charts that provide a count of relevant rows, such as cases by priority or by status.Both dashboards contain tile view.In Tile view you can show count of Cases,Leads,Opportunities etc. Single-stream dashboards have tile view on the same page. When in the Multi-stream dashboard, we need to click on the ribbon button name “Switch to Tile View” for Tile view.
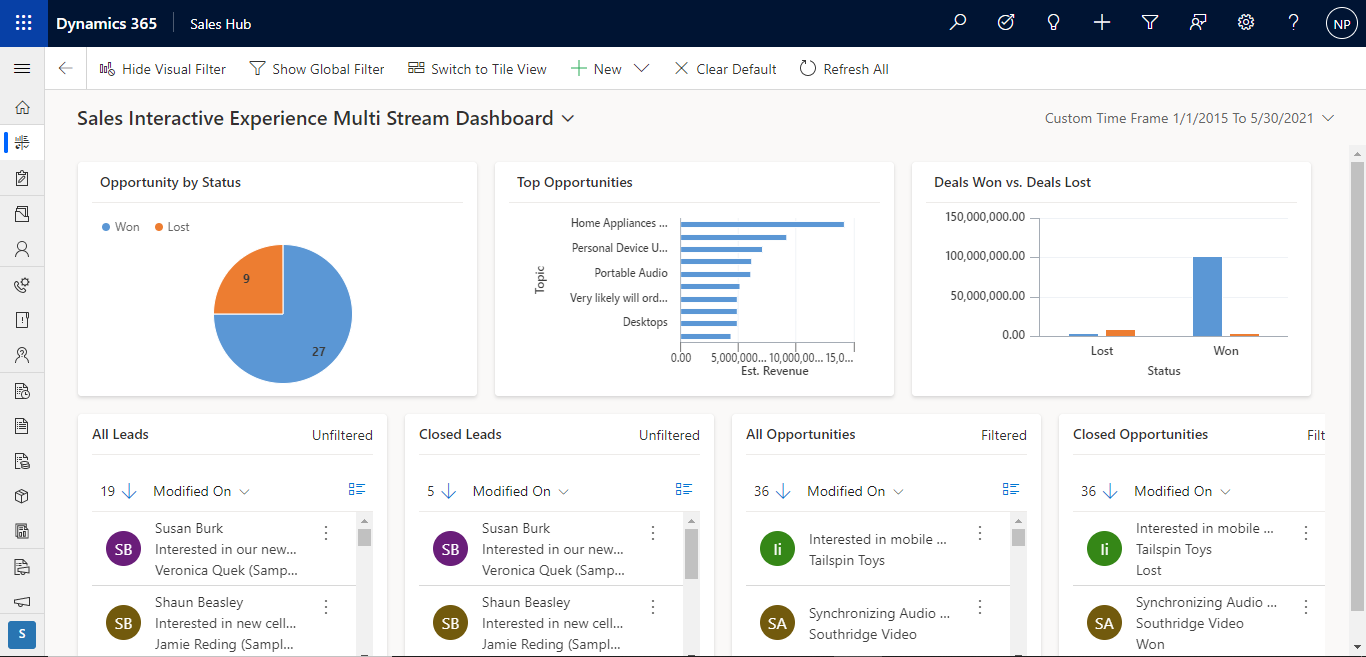
Here is an example of a Multi Stream dashboard
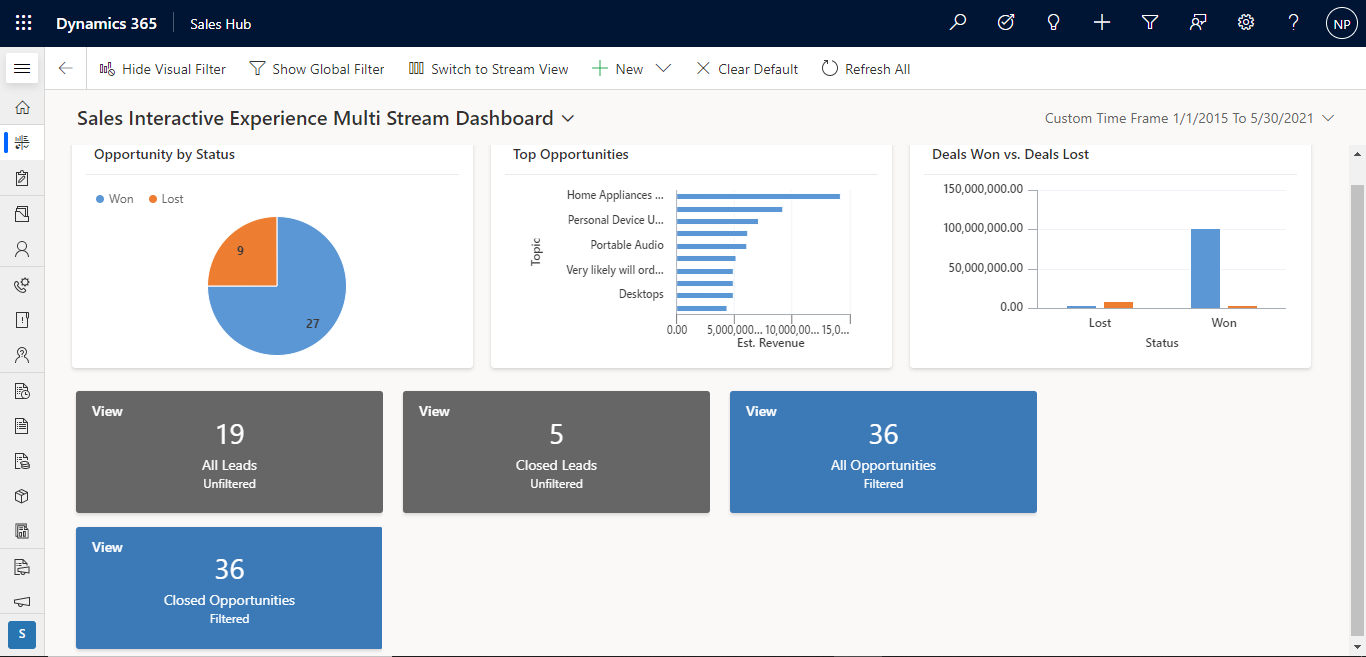
Here is an example of Multi Stream dashboard in tile view.
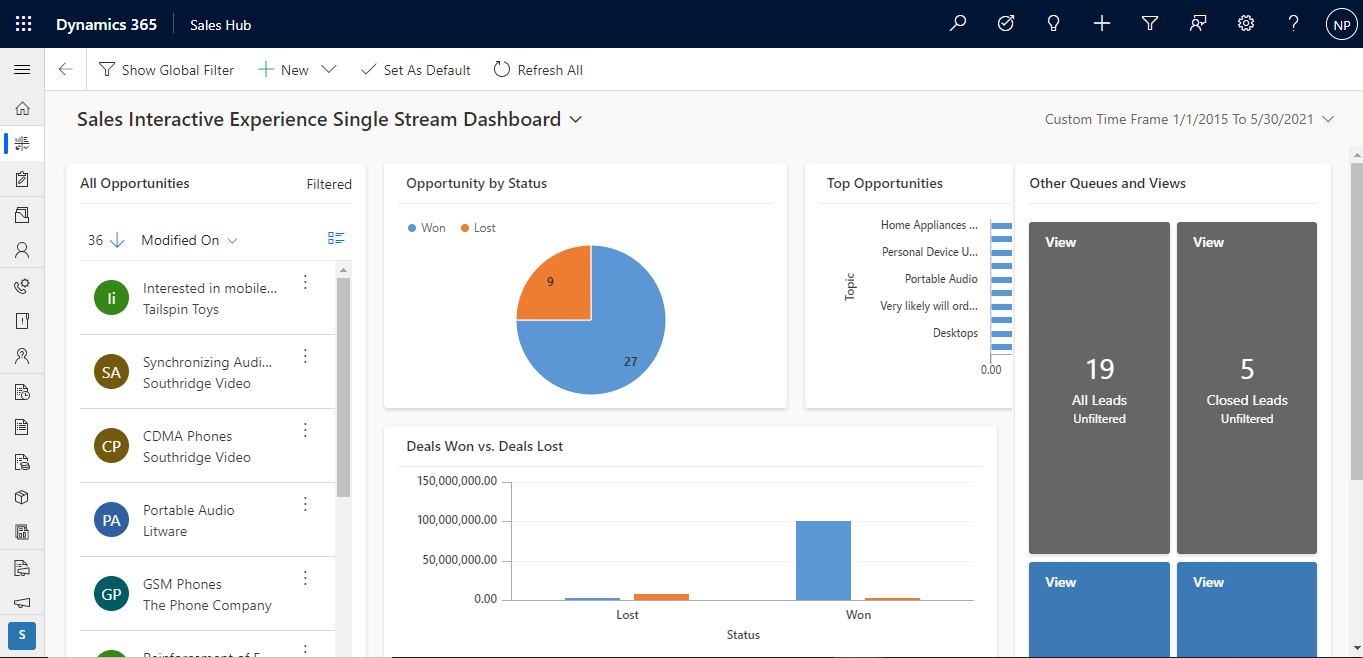
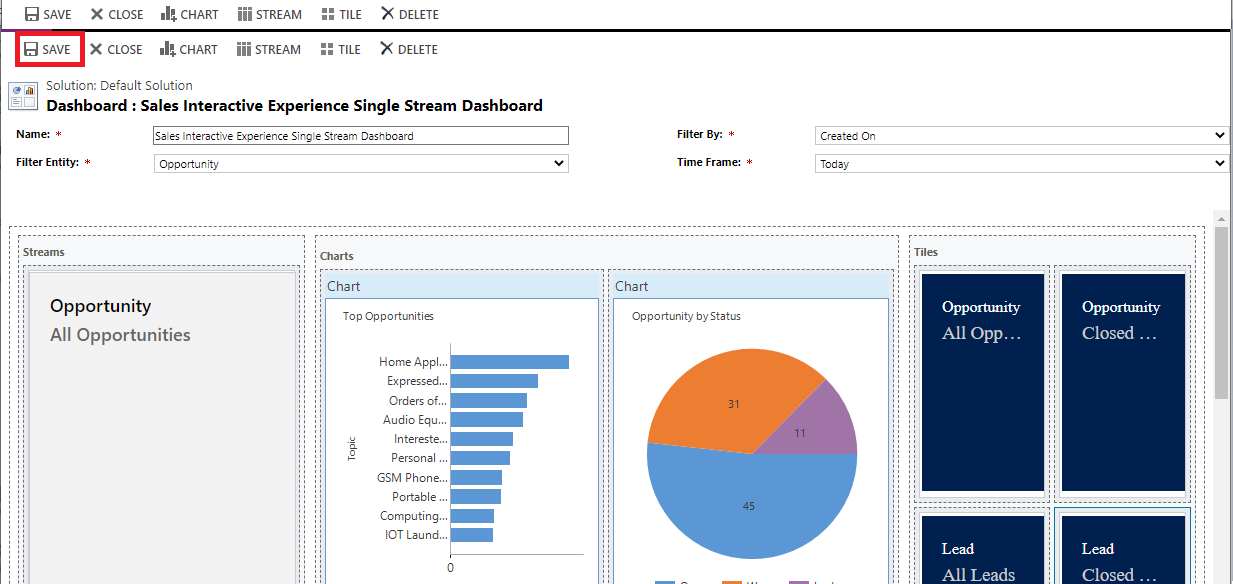
Here is an example of Single Stream dashboard
Steps to create a Multi Stream dashboard
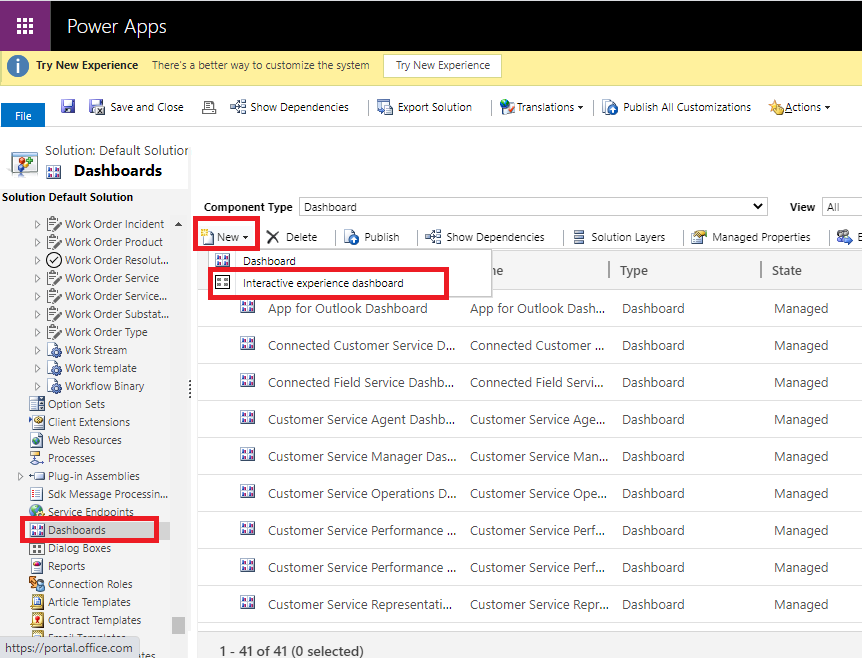
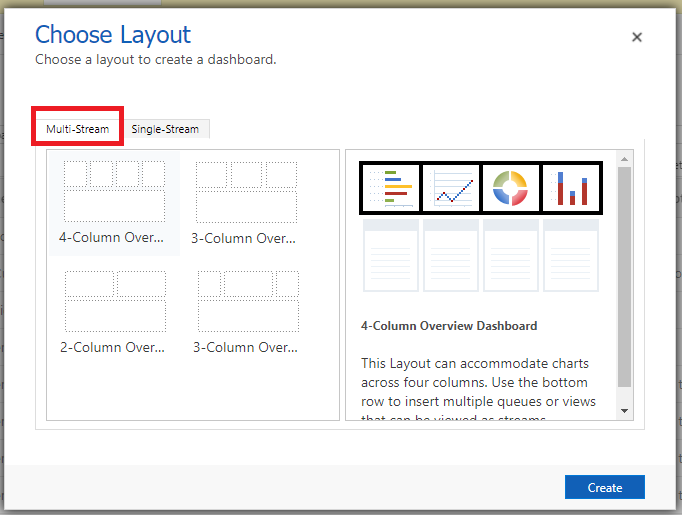
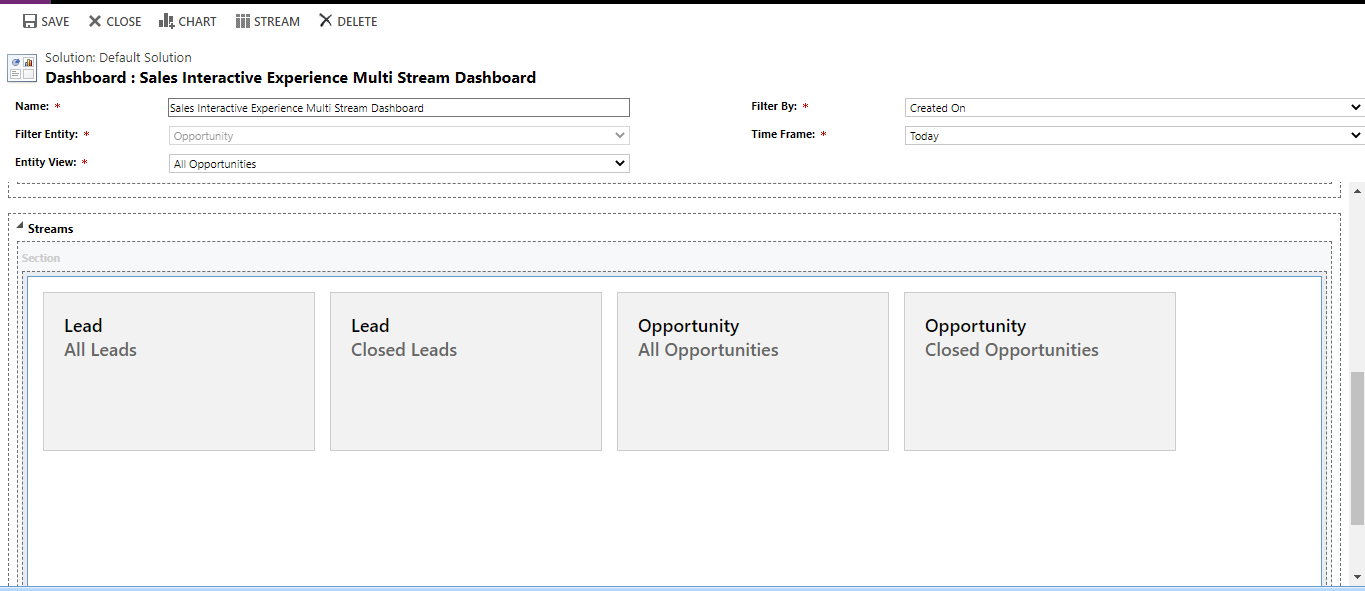
Open Solution and in the left navigation bar, select Dashboards, on the toolbar select new, and then select Interactive Experience Dashboard.
Then Choose layout. Select any 2, 3 or 4 column width layout.I have selected 3 column layout over here.
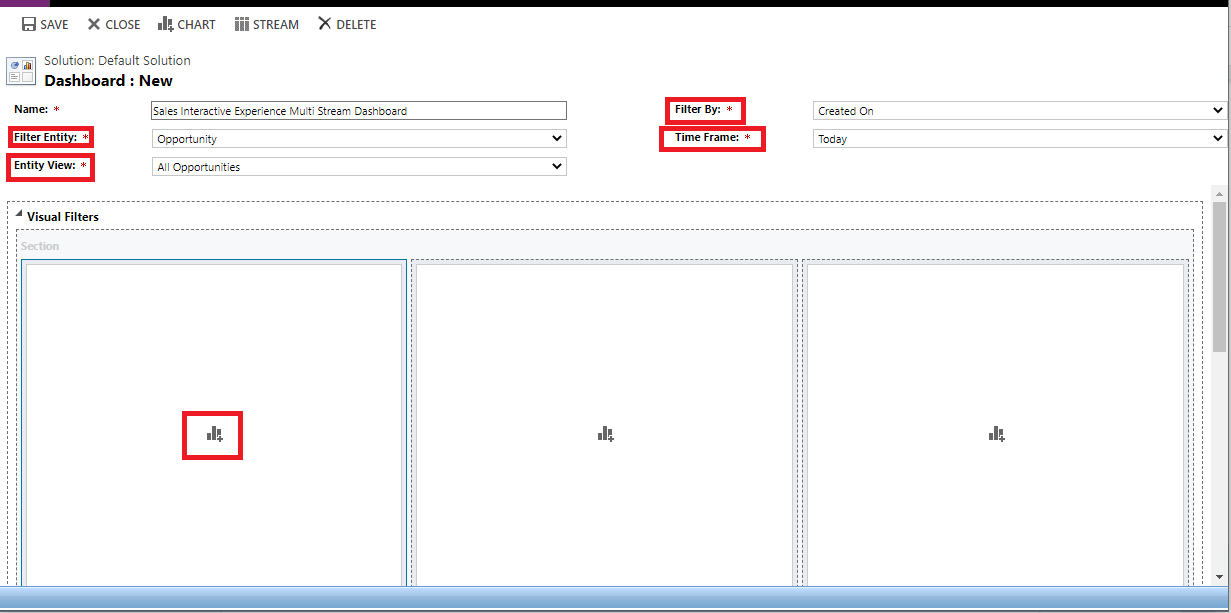
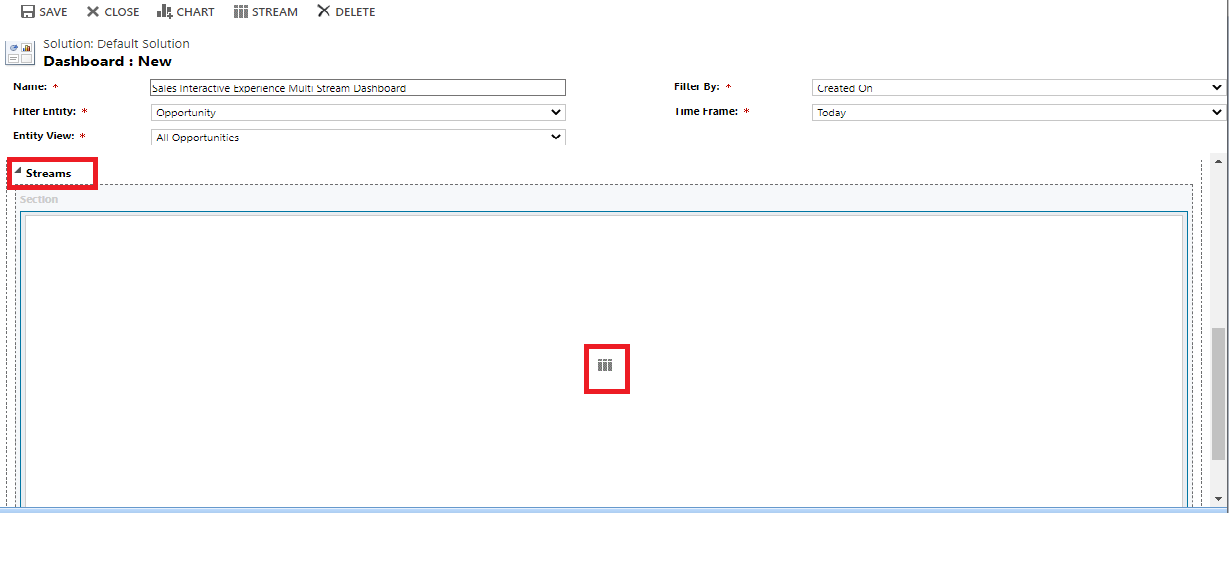
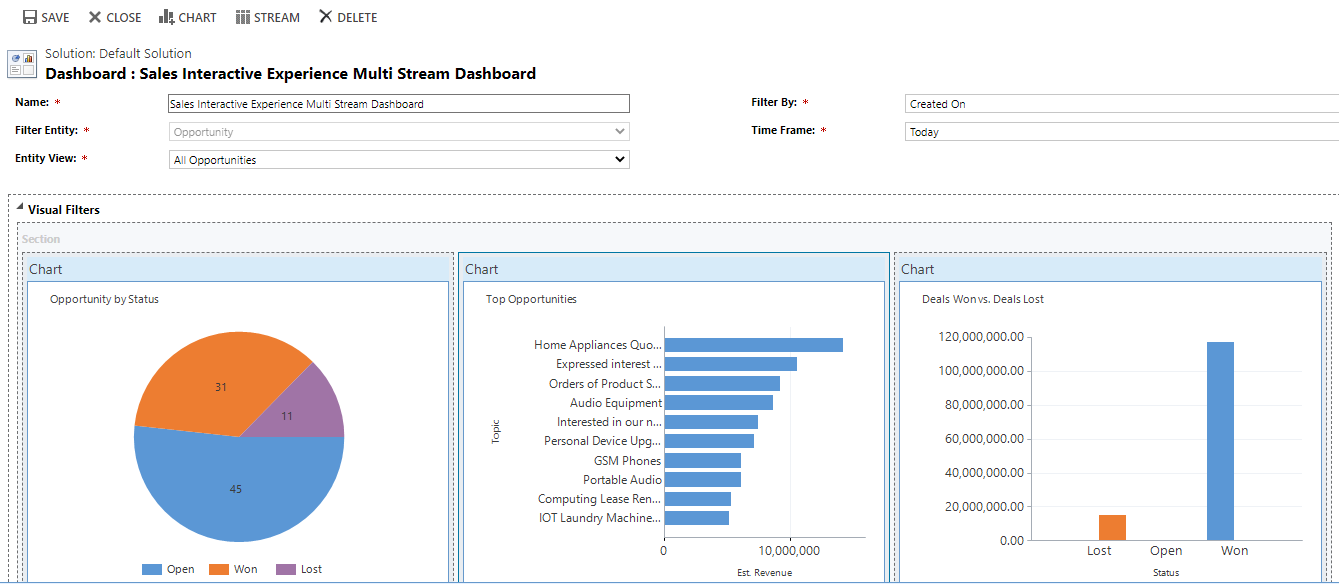
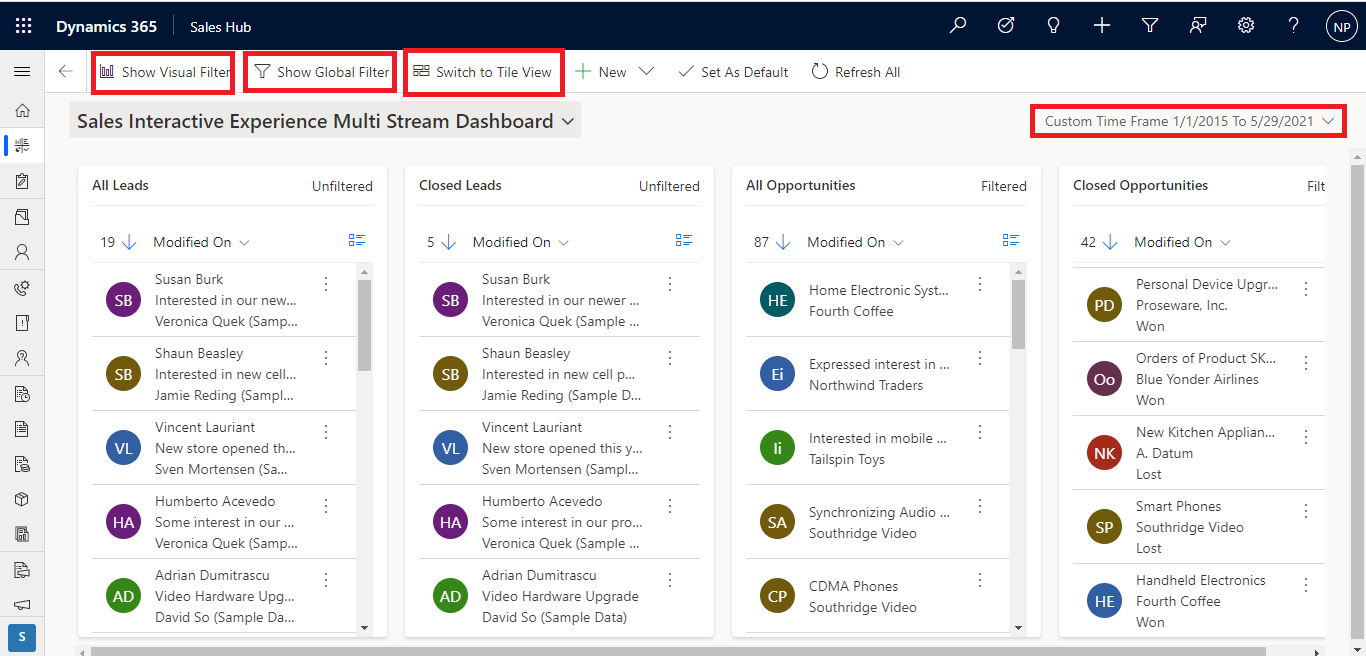
If you want to show charts then click on “Show Visual filter” button as shown in above screenshot. After clicking on the button you can see the dashboard like below.You can also hide charts by clicking on button “Hide Visual Filter”.
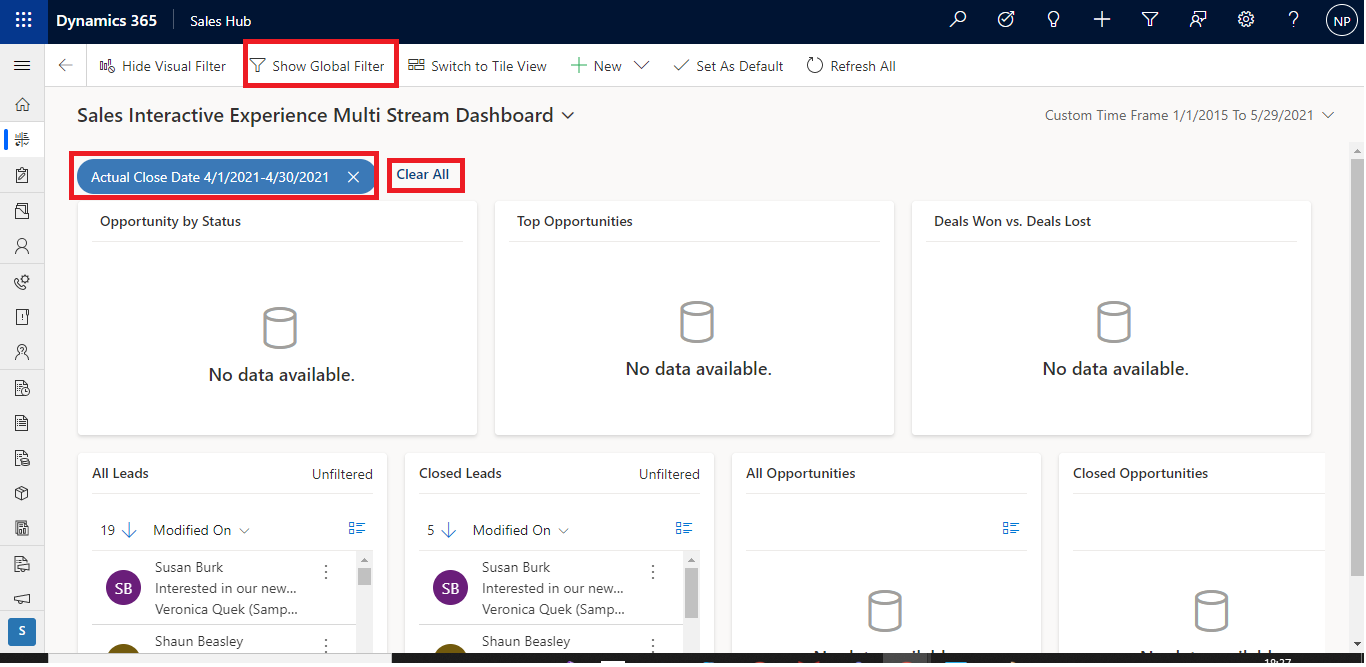
If you want to apply filter on all records shown in all views, you can click on the button “Show Global Filter”. After applying the Global filter you can see the dashboard like below. Here I have applied a filter on Actual Close date. You can clear filters also.
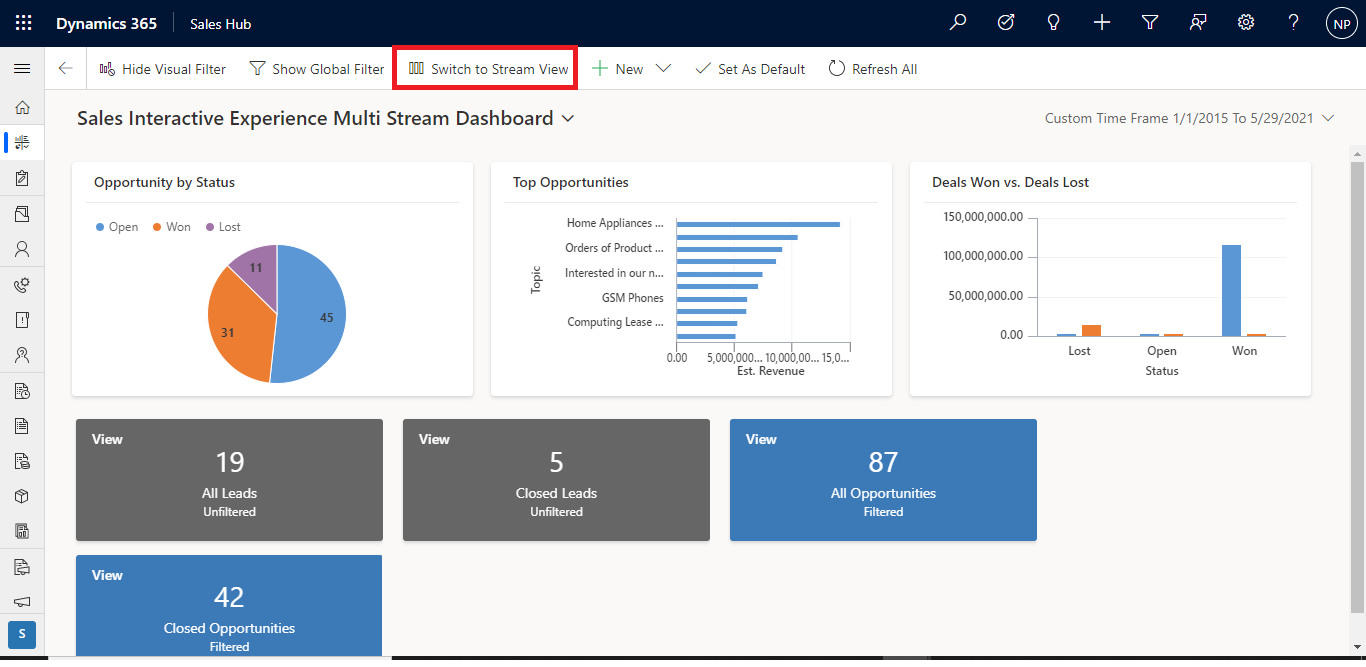
If you want to show Count of Records view wise then click on button “Switch to Tile View”. You can see it below. Then you can click back on “Switch to Stream View”.
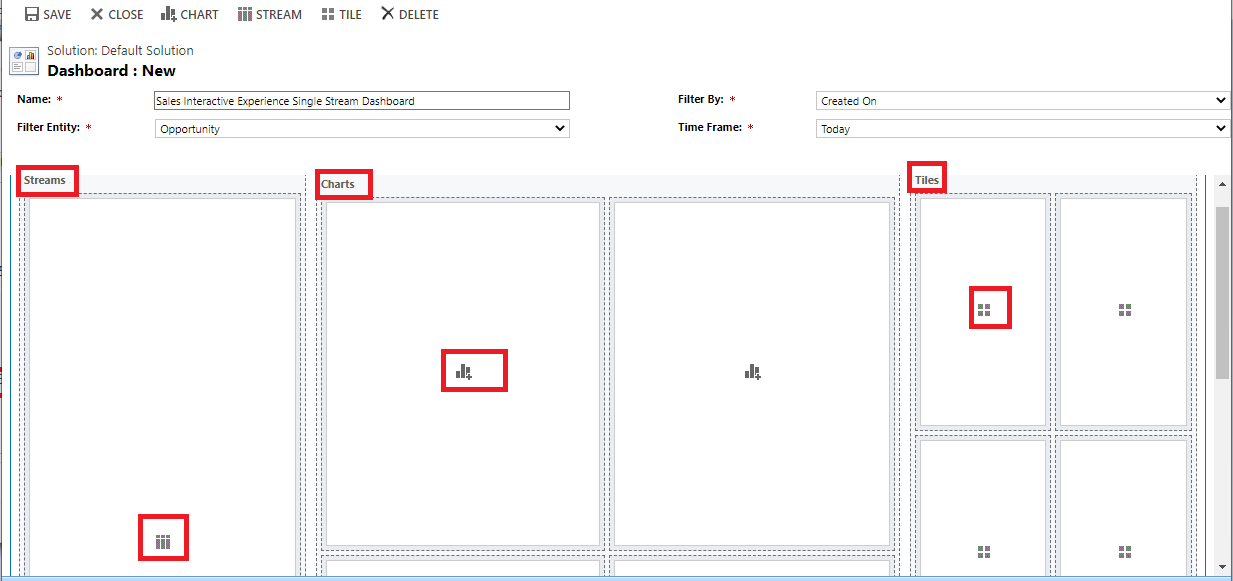
Steps to create a Single Stream dashboard
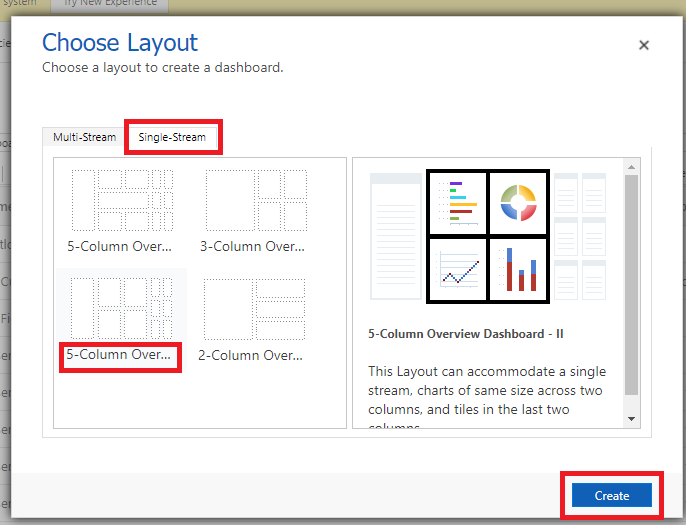
For single stream dashboard, Select single stream and select layout. If you want to show Tile View(Count of records) also then select 5-Column layout otherwise select 3 or 2 column layout.Here I have selected 5-Column layout.

Hope this helps
ATM Inspection PowerApp to ease ATM inspection and report generation process.
https://www.inkeysolutions.com/microsoft-power-platform/power-app/atm-inspection
Insert data into Many-to-Many relationship in Dynamics CRM very easily & quickly, using the Drag and drop listbox.
http://www.inkeysolutions.com/what-we-do/dynamicscrmaddons/drag-and-drop-listbox
Comply your Lead, Contact, and User entities of D365 CRM with GDPR compliance using the GDPR add-on.
https://www.inkeysolutions.com/microsoft-dynamics-365/dynamicscrmaddons/gdpr
Create a personal / system view in Dynamics CRM with all the fields on the form/s which you select for a particular entity using the View Creator.
http://www.inkeysolutions.com/what-we-do/dynamicscrmaddons/view-creator
INKEY is your solution partner.
Our focus is to deliver you in-time intelligent innovative solutions ("key") for the problems in hand. Maintaining a quality standard right from the inception of a project is our top most priority.
Our team of talented professionals will execute your projects with dedication and excellence. We take ownership and accountability for the effort that goes into meeting our client’s needs.
Years of experience and proven success of delivering innovative custom solutions.


© All Rights Reserved. Inkey IT Solutions Pvt. Ltd. 2024


Leave a Reply