
Ever thought of manipulating the data in your SQL data source directly from the Power BI Report? If yes, our prayers have been heard (as the use of Power Automate within Power BI is still in Preview as of writing this blog) and will be answered soon (when made GA)!
An exciting new feature was released (preview) in April by the Power BI team, which is Power Automate Visual. This visual adds a lot of possibilities directly to Power BI without relying on Power Apps.
Users can now directly trigger Power Automate Flow from within Power BI & pass the required data from Power BI Report to the Power Automate. This isn’t limited to operations like sending emails or creating tasks, in fact, you can even perform powerful data manipulation operations directly from Power BI. Here, we will take an example to show how users can update records in a SQL database from Power BI using Power Automate.
Let’s say there is an application using which a Sales Manager sets the monthly targets of the Sales Executives reporting to him. And he also has access to a Power BI report related to the targets. The present situation is, the Sales Manager need to toggle between the Power BI report & the application to update the Sales Targets if he needs to while viewing the report. But we can make his life a lot easier by giving him a feature to update the Target values directly from Power BI using Power Automate.
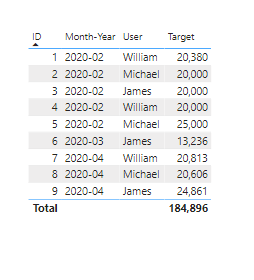
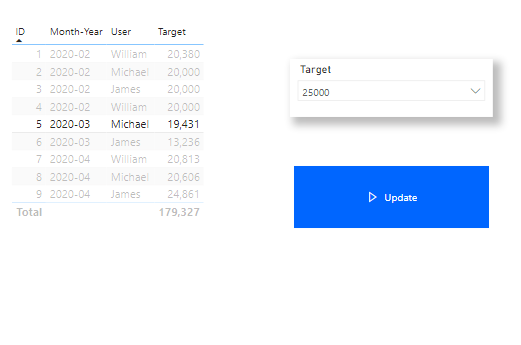
This is how the Sales Target visual look like in the Power BI report:
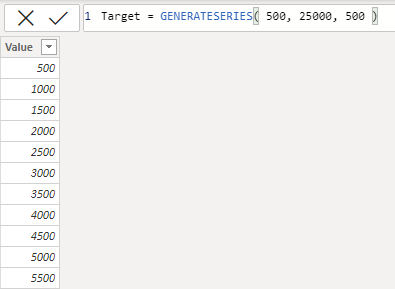
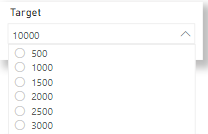
And to enable the input for the new Target, we have created a table with predefined values in Power BI. This is the structure of the table:
With all this set, let’s jump in to understand the steps we need to follow to design the Power Automate to update our SQL data source with the new Target value.
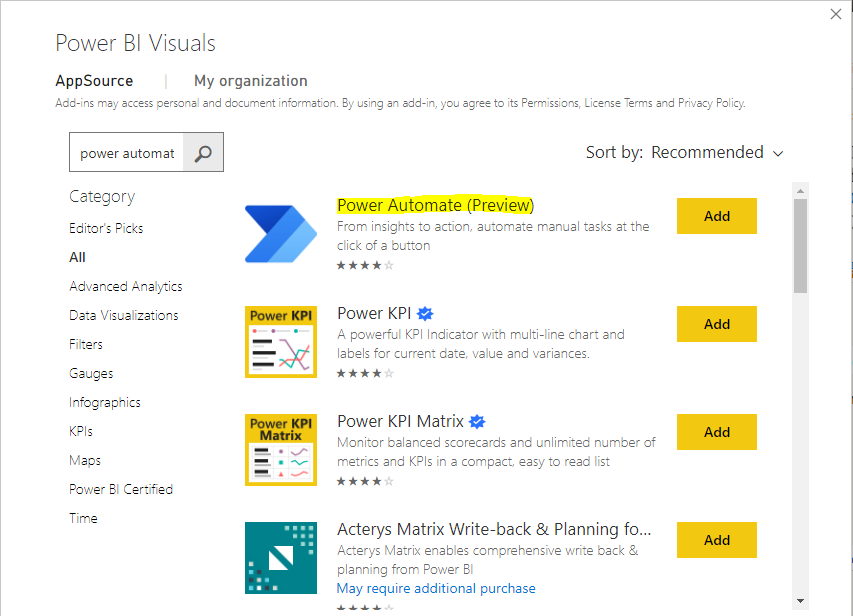
Let’s add the Power Automate Visual from visualizations.
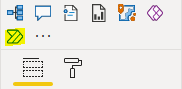
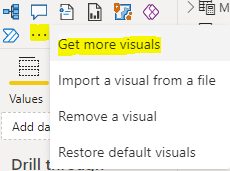
In case if you’re not able to see the Power Automate Visual in visualization then please update the Power BI Desktop or you can add Power Automate Visual from the AppSource and plot it on the report page.
By adding the visual on the page you can see the visual contains some instruction at the initial level. You can scroll down or resize the visual to see all the instructions.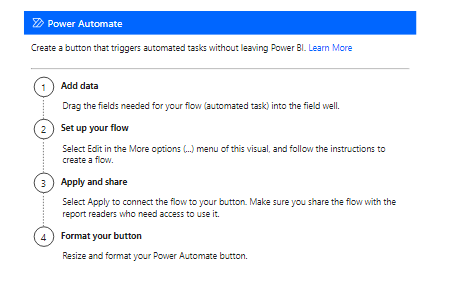
Once you’ve reviewed the instructions, place the button as per your need. You can change the size and name of the button by going to Format settings.
In order to update the SQL database, we will have to pass data from the Power BI report to Power Automate via this visual.
So, first, we will see how to pass the Target value. We have the Target field from the Target table in the slicer, so that the user can select the amount, and then this value would be passed to the Power Automate flow.
And, to pass the target value from the slicer, we need to have a measure that returns the selected value of the Target from the slicer.
You can create the measure as follows:
Selected Target = SELECTEDVALUE(Target[Value])
For the flow to know exactly which record to update, we need to pass the value of the primary key as well. Hence, we’ll create the measure to pass the value of the primary key. Here, our primary key is the “ID” column of the Sales Target table. In addition to that, we’ll create the values for other fields as well.
Selected ID = SELECTEDVALUE( ‘Sales Target'[ID] )
Selected Month Year = SELECTEDVALUE( ‘Sales Target'[Month-Year] )
Selected Sales Executive= SELECTEDVALUE( ‘Sales Target'[Sales Executive] )
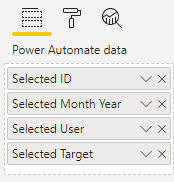
After creating the above measures, we would add these measures to Power Automate Visual.
Now, it’s time to design the Power Automate. To set up the Power Automate, go to the ellipsis option on top of the visual, and select the edit as shown below.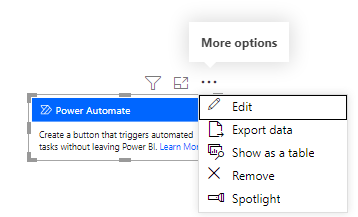
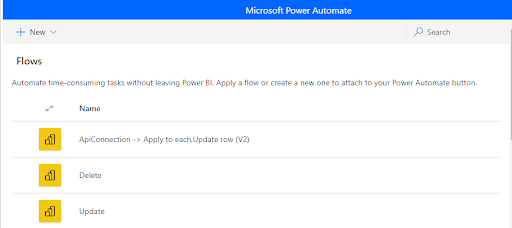
After clicking on the edit, you will see existing flows if any. You can either select the existing one to use it or you can create a new flow.
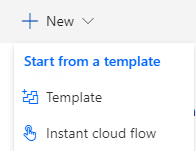
Here we will create a new flow. So, just click on the + New and select instant cloud flow.
Now, click on the new step, search for the SQL Server and choose the Update row (V2).
Configure the ‘Update Row V2’ to connect to your SQL Server by entering the Server name, Database name, and the table that we want to update. After adding the connection add the Selected ID, Selected Month Year, Selected Sales Representative, and Selected Target into the ID, Month Year, User, and Target value. Click on ‘Save and apply’ and then ‘Back to report’.
Now, select the record which you want to update. We’ve selected the below record with a target value of 25,000. Let’s trigger the flow by clicking the “Update” button.
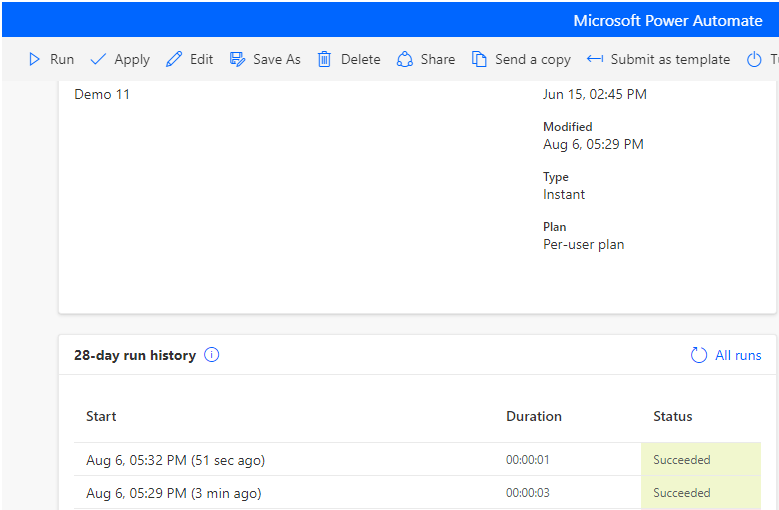
Once it’s triggered, click on ‘Edit’ and check the run history. As you can see, our flow runs successfully.
Let’s refresh the data and validate if the value has been updated or not.
The whole process can be done as shown in the below gif:
Similarly, you can configure ‘Insert Row (V2)’ and ‘Delete Row’. Please let us know if you need us to come up with blogs for Insert and Delete rows.
We have seen everything as to how to update the row, but it will be awesome to see the change on the report instantly without the refreshing of the tables after each time we update the value.
Stay tuned for the next blog where we’ll explain how to achieve it.
Happy Updating from Power BI!
INKEY is your solution partner.
Our focus is to deliver you in-time intelligent innovative solutions ("key") for the problems in hand. Maintaining a quality standard right from the inception of a project is our top most priority.
Our team of talented professionals will execute your projects with dedication and excellence. We take ownership and accountability for the effort that goes into meeting our client’s needs.
Years of experience and proven success of delivering innovative custom solutions.


© All Rights Reserved. Inkey IT Solutions Pvt. Ltd. 2024


Dear,
ı am trying to use power automate in a report that is published and refreshed in a power bi report server. Actually, there is no visual in report design, can you help me about how can I proceed ?