Implementing Dynamic Cascading Slicer To Filter the Data
Recently, for Power BI, we encountered a requirement where we have Delivery data, and we want Slicer which gives a range of “Delivery Per Customer”(Count of Deliveries) that seamlessly integrates with all visuals in the dashboard. Specifically, a scenario where, upon selecting a date range, the “Delivery Per Customer” slicer dynamically operates on the filtered data within that date range and other Slicer filter rather than the entire static table. Utilizing a visual-level filter on the “Delivery Per Customer” slicer, we’ve accomplished this. The purpose of this blog extends beyond just this achievement; it also explores how to apply the same slicer to filter other visuals.
Let’s explore the necessary steps to accomplish this:
Create a “Delivery Counts” table. This table will hold values from 0 to the maximum possible number of Deliveries, using the Generate series function. In this case, the maximum possible Delivery per customer = the total records in the Delivery table, assuming we have only one customer. Hence, we have generated a series of numbers from 0 to #TotalDeliveries.
Delivery Per Customer =
COUNT ('Delivery Data'[Delivery Number])

Delivery Counts =
GENERATESERIES (0, [Delivery Per Customer],1)
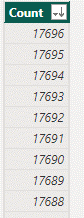
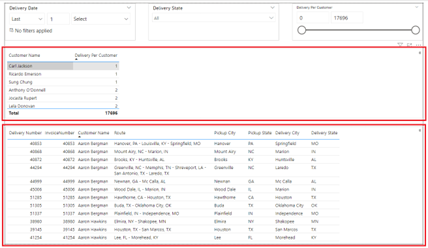
Below images shows the series in Ascending & Descending order to give an idea about the current range based on the existing data.

Further, the count column of this table is used to slice our data using the “Delivery Per Customer” slicer. The Count column will be dynamically updated when new Deliveries are added. Create a slicer named “Delivery per customer” using the “Count” column from the “Delivery Counts” table.
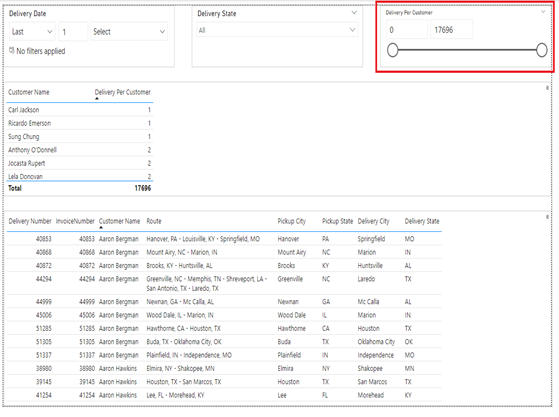
As we have to control the Min & Max value shown in the “Delivery per Customer” slicer, we have created “Delivery Per Customer Slicer Filter” measure to filter out the values in “Delivery Per Customer” slicer.
Delivery Per Customer Slicer Filter =
VAR Virtual =
CALCULATETABLE(
        SUMMARIZE(
                    'Delivery Data',
                    'Delivery Data'[Customer Name],
                    "Total loads", [Delivery Per Customer]
                )
    )

VAR MinValue =

            MINX (Virtual,[Total loads])

VAR MaxValue =

MAXX(Virtual,[Total loads])

VAR CurrentSelectedValue = SELECTEDVALUE ('Delivery Counts'[Count])
RETURN

IF(
    CurrentSelectedValue >= MinValue && CurrentSelectedValue <= MaxValue
    ,1
    ,0
)
This measure will return ”1” if the current slicer value lies between the Min & Max Delivery count per Customer else ”0”.
Discover the power of our services:
Microsoft Fabric, Power BI, Microsoft Business Intelligence, SQL Server, and Business Central. By the power of these services, from advanced analytics to seamless business integration, we’ve got the expertise you need to optimize operations and drive growth. Harness the potential of your data infrastructure with our comprehensive suite of solutions.
The “Delivery Per Customer Slicer Filter” measure is used as a visual level filter on the “Delivery Per Customer” slicer, and it will only permit the values based on the values of underlying “Delivery Data” table.
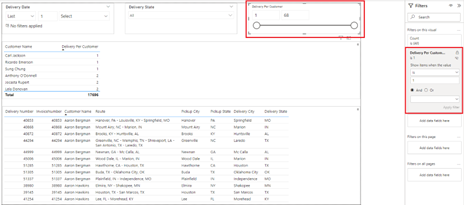
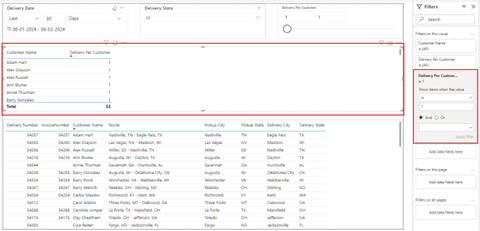
We have created another measure named “Delivery Per Customer Table Filter” to filter out the values in highlighted below screen shot visuals.
Delivery Per Customer Table Filter =
 VAR MinDeliveryCount = MIN('Delivery Counts'[Count])

 VAR MaxDeliveryCount = MAX('Delivery Counts'[Count])

 VAR CurrentValue = [Delivery Per Customer]

 RETURN

 IF(
        CurrentValue >= MinDeliveryCount && CurrentValue <= MaxDeliveryCount
        ,1
        ,0
    )
Here, we have calculated the Minimum and Maximum count of Delivery based on a selection of “Delivery per customer” slicer and stored them in MinDeliveryCount and MaxDeliveryCount variables respectively. After that we created another variable named CurrentValue which stores “Total Delivery” for the Customer in context. At last, we checked whether the CurrentValue is in the range of MinDeliveryCount and MaxDeliveryCount if this condition is true then it will return 1 else it will return 0.
The “Delivery Per Customer Table Filter” measure is used as a visual level filter on the table highlighted in the below screenshot, and it will only permit the values based on the values selected in the “Delivery Per Customer” slicer.
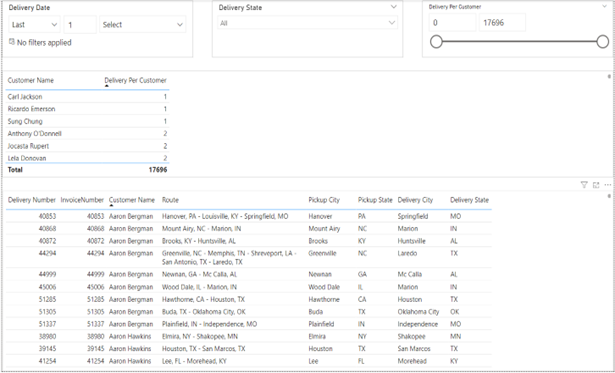
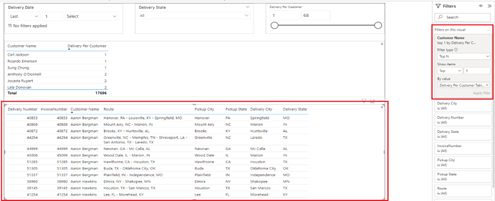
We have used “Delivery Per Customer Table Filter” used as a visual level filter of TOP 1 Customers, on the table highlighted below. This will return all the customer per Delivery who fall in the selection of the “Delivery Per Customer” slicer.
In conclusion, our implementation of a Dynamic Cascading Slicer for “Delivery Per Customer” data provides a powerful tool for seamless integration with dashboard visuals. By creating a dedicated “Delivery Counts” table and utilizing measures like “Delivery Per Customer Slicer Filter” and “Delivery Per Customer Table Filter,” we achieve dynamic filtering within selected date ranges. This solution offers flexibility with dataset changes, automatically updating slicer ranges. Visual-level filtering enhances user experience, ensuring accurate data representation. These steps empower BI professionals to implement an interactive and user-friendly Power BI dashboard, reflecting the evolving landscape of Business Intelligence.
FAQ :
1. All these measures are required to do the slicer?
Ans. Yes
2. Also, if I added other visuals, no edits are required?
Ans. If other visuals are added, we must apply on visual level filter using the “Delivery per Customer Table filter”, on the Customer as done in the last step above.
3. Also, regarding the Delivery Table, If I add new columns to it, it would still work? or it will need modifications?
Ans. No changes are needed if new columns to this table. Yes, but need to ensure that this table is not getting filtered in any other way, or else it will impact the overall filtration logic.
Know the number of records in any Dataverse entity or table.
https://inkeysolutions.com/entity-record-counter
ATM Inspection PowerApp to ease ATM inspection and report generation process.
https://inkeysolutions.com/microsoft-power-platform/power-app/atm-inspection
Insert data into Many-to-Many relationship in Dynamics CRM very easily & quickly, using the Drag and drop listbox.
http://inkeysolutions.com/what-we-do/dynamicscrmaddons/drag-and-drop-listbox
Comply your Lead, Contact, and User entities of D365 CRM with GDPR compliance using the GDPR add-on.
https://inkeysolutions.com/microsoft-dynamics-365/dynamicscrmaddons/gdpr
Create a personal / system view in Dynamics CRM with all the fields on the form/s which you select for a particular entity using the View Creator.
http://inkeysolutions.com/what-we-do/dynamicscrmaddons/view-creator