Revolutionizing DAX with the Magic of Visual Calculation in Power BI
The February 2024 update marks a transformative shift in DAX in Power BI writing with the introduction of visual calculations!
Visual calculations entail defining and executing DAX calculations directly within a visual. These calculations have the flexibility to reference any data within the visual, be it columns, measures, or other visual calculations. This innovative approach streamlines the DAX writing process by bypassing the intricacies of the semantic model. With visual calculations, performing common business calculations like running sums or moving averages becomes effortless. This breakthrough empowers users to effortlessly tackle calculations that were once challenging or nearly impossible.
Enabling Visual Calculation Preview feature
To utilize visual calculations during the preview phase, you must activate this feature in Options and Settings → Options ️→ Preview features. Simply choose visual calculations and click OK. The activation of visual calculations will take effect once Desktop is restarted.
How is Visual Calculation beneficial?
With visual calculations, users gain the capability to construct fresh calculations directly from any visual within Power BI, utilizing an Excel grid-like interface. This feature empowers users to articulate their new formulas within a grid and reference other cells within it to derive calculations. Many users currently face challenges in crafting DAX calculations, especially those involving tasks like generating running totals. In Excel, a user might effortlessly reference the previous value from a cell. The advent of visual calculation abilities enables users to harness previous values efficiently, facilitating the rapid construction of highly intricate formulas.
Discover the power of our services:
Microsoft Fabric, Power BI, Microsoft Business Intelligence, SQL Server, and Business Central. By the power of these services, from advanced analytics to seamless business integration, we’ve got the expertise you need to optimize operations and drive growth. Harness the potential of your data infrastructure with our comprehensive suite of solutions.
Let’s look at how we can calculate the running total using visual calculation.
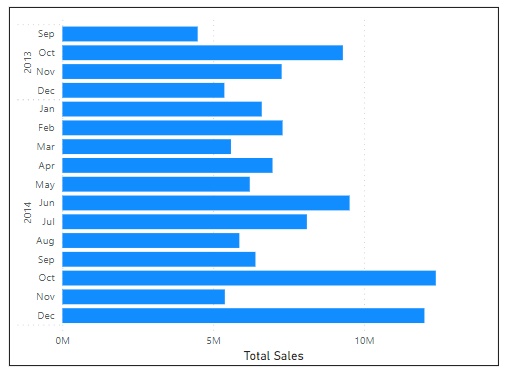
Here we have loaded the default sample data which Power BI Provides from which we have created Total Sales Measure and plotted it in Bar chart as below.
Now to add a Visual Calculation we will select our chart and click on the New Calculation option in Calculation option under Home Menu.

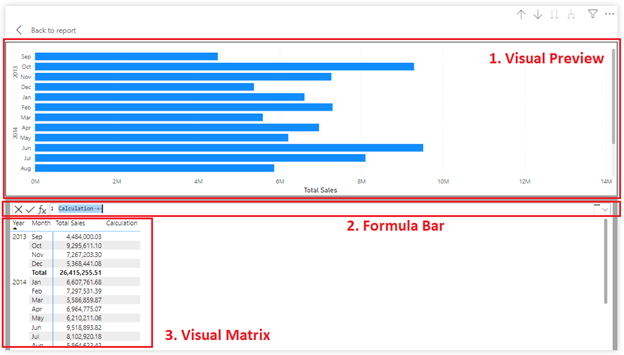
This will open the visual calculations edit mode. This screen consists of three major parts listed below:
- Visual Preview: Shows the Visual which we are working with.
- Formula Bar: Where we can add the expression for calculation we want to perform.
Visual Matrix: Shows the data of the visual and the calculations we add to it.
Now, in the formula bar we can write the DAX to calculate the Running Total of Sales or can use the templates available by clicking on “fx” button beside formula bar.
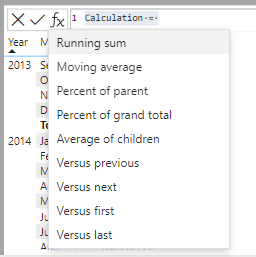
From the drop down we will select Running sum and pass the “Total Sales” measure whose Running total we want to calculate.
![]()
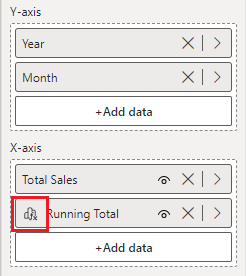
Now after clicking Enter, we can see that Running Total Column is added and plotted in the visual.

By default, visual calculations are evaluated row by row on a visual, resembling the behavior of a calculated column. While it’s feasible to include aggregation functions like SUM, it’s unnecessary, and, in fact, advisable to refrain from adding them unless essential. This practice enhances clarity, allowing a clearer distinction between measures and expressions in visual calculations.
We can also distinguish between measure and Visual Calculation by the Special Icon of Visual calculation in Build a Visual Pane where other columns and measures are plotted as below.
In Visual calculations (preview feature) following templates are available.
- Running sum:
Calculates the sum of values, adding the current value to the preceding values.
Uses the RUNNINGSUM function. - Moving average:
Calculates an average of a set of values in a given window by dividing the sum of the values by the size of the window.
Uses the MOVINGAVERAGE function. - Percent of parent:
Calculates the percentage of a value relative to its parent.
Uses the COLLAPSE function. - Percent of grand total:
Calculates the percentage of a value relative to all values, using the COLLAPSEALL function. - Average of children:
Calculates the average value of the set of child values.
Uses the EXPAND function. - Versus previous:
Compares a value to a preceding value, using the PREVIOUS function. - Versus next:
Compares a value to a subsequent value, using the NEXT function. - Versus first:
Compares a value to the first value, using the FIRST function. - Versus last:
Compares a value to the last value, using the LAST function.
Though Visual Calculation makes our work easy it has some limitations we should be aware of are listed below.
- Not all visual types are compatible. Utilize the visual calculations edit mode to switch visual types, noting that custom visuals haven’t undergone testing with visual calculations or hidden fields.
- The following visual types and properties have been tested and found incompatible with visual calculations or hidden fields:
- Line and stacked column chart
- Treemap
- Map
- Shape Map
- Azure Map
- Slicer
- R visual
- Python visual
- Key Influencers
- Decomposition Tree
- Q&A
- Smart Narrative
- Metrics
- Paginated Report
- ArcGIS Maps
- Power Apps
- Power Automate
- Small multiples
- Visual calculations and hidden fields can only be added and edited using Power BI Desktop. While reports containing visual calculations can be published to the Power BI service, editing is restricted within the service.
- Performance may differ from the final product.
- Reuse of visual calculations through copy/paste or other means is not available.
- Filtering on visual calculations is not supported.
- A visual calculation cannot refer to itself on the same or different detail level.
- Personalization of visual calculations or hidden fields is not available.
- The Publish to web functionality is incompatible with reports using visual calculations or hidden fields.
- Exporting underlying data from visuals with visual calculations or hidden fields is not possible.
- The see records drill-through functionality is not supported for visuals using visual calculations or hidden fields.
- Built-in or custom format strings cannot be set on visual calculations.
- Conditional formatting cannot be applied to visual calculations.
- Data categories cannot be set on visual calculations.
- Aggregations on visual calculations cannot be changed.
- The sort order for visual calculations cannot be modified.
- Power BI Embedded is not supported for reports using visual calculations or hidden fields.
- Live connections to SQL Server’s Analysis Services (part of Microsoft Business Intelligence) are not supported.
- Field parameters cannot be used with visual calculations.
- “Show items with no data” is not available with visual calculations.
Conclusion:
The February 2024 update ushers in a groundbreaking era for DAX writing, introducing visual calculations that redefine data analysis in Power BI. This innovative feature allows users to seamlessly perform calculations within visuals, unlocking unparalleled flexibility in referencing data elements. By simplifying complex tasks like running totals, visual calculations empower users to effortlessly navigate previously intricate scenarios. Despite some limitations, such as compatibility constraints and the need for careful consideration, the benefits of visual calculations are undeniable. As we embrace this transformative tool, its potential to elevate DAX writing becomes evident, promising a more intuitive and efficient analytical journey within Power BI.
Know the number of records in any Dataverse entity or table.
https://inkeysolutions.com/entity-record-counter
ATM Inspection PowerApp to ease ATM inspection and report generation process.
https://inkeysolutions.com/microsoft-power-platform/power-app/atm-inspection
Insert data into Many-to-Many relationship in Dynamics CRM very easily & quickly, using the Drag and drop listbox.
http://inkeysolutions.com/what-we-do/dynamicscrmaddons/drag-and-drop-listbox
Comply your Lead, Contact, and User entities of D365 CRM with GDPR compliance using the GDPR add-on.
https://inkeysolutions.com/microsoft-dynamics-365/dynamicscrmaddons/gdpr
Create a personal / system view in Dynamics CRM with all the fields on the form/s which you select for a particular entity using the View Creator.
http://inkeysolutions.com/what-we-do/dynamicscrmaddons/view-creator